第12章静的つり合いと弾性
12.4 Elasticity and Plasticity12.4 弾性と塑性
Learning Objectives学習目標
Learning Objectives学習目標
By the end of this section, you will be able to:
英語のヒント
この節を終えると、次のことができるようになる。
- Explain the limit where a deformation of material is elastic
英語のヒント
材料の変形が弾性的である限界を説明する。 - Describe the range where materials show plastic behavior
英語のヒント
材料が塑性的に振る舞う範囲を説明する。 - Analyze elasticity and plasticity on a stress-strain diagram
英語のヒント
応力–ひずみ線図から、弾性と塑性を分析する。
We referred to the proportionality constant between stress and strain as the elastic modulus. But why do we call it that? What does it mean for an object to be elastic and how do we describe its behavior?
英語のヒント
応力とひずみの比例定数を弾性率と呼んできた。しかし、なぜそう呼ぶのだろうか。物体が弾性を持つとはどういう意味で、その振る舞いをどう記述するのだろうか。
Elasticity is the tendency of solid objects and materials to return to their original shape after the external forces (load) causing a deformation are removed. An object is elastic when it comes back to its original size and shape when the load is no longer present. Physical reasons for elastic behavior vary among materials and depend on the microscopic structure of the material. For example, the elasticity of polymers and rubbers is caused by stretching polymer chains under an applied force. In contrast, the elasticity of metals is caused by resizing and reshaping the crystalline cells of the lattices (which are the material structures of metals) under the action of externally applied forces.
英語のヒント
弾性とは、変形を起こす外力(荷重)を取り除いた後に、固体の物体や材料が元の形へ戻ろうとする性質である。荷重がなくなったとき、元の大きさと形に戻る物体を、弾性を持つという。弾性の物理的な原因は材料によって異なり、微視的な構造に依存する。例えば、高分子やゴムの弾性は、力が加わると高分子鎖が伸びることから生じる。これに対し金属の弾性は、外力によって結晶格子(金属を構成する構造)の単位胞の大きさや形が変わることから生じる。
The two parameters that determine the elasticity of a material are its elastic modulus and its elastic limit. A high elastic modulus is typical for materials that are hard to deform; in other words, materials that require a high load to achieve a significant strain. An example is a steel band. A low elastic modulus is typical for materials that are easily deformed under a load; for example, a rubber band. If the stress under a load becomes too high, then when the load is removed, the material no longer comes back to its original shape and size, but relaxes to a different shape and size: The material becomes permanently deformed. The elastic limit is the stress value beyond which the material no longer behaves elastically but becomes permanently deformed.
英語のヒント
材料の弾性を決める二つの量は、弾性率と弾性限界である。弾性率が大きい材料は変形しにくく、大きなひずみを生じさせるには大きな荷重が必要である。鋼の帯がその例である。弾性率が小さい材料は、荷重によって容易に変形する。例えば輪ゴムである。荷重による応力が大きすぎると、荷重を取り除いても、材料は元の形と大きさに戻らず、別の形と大きさに落ち着く。永久変形が生じた状態である。弾性限界は、それを超えると材料が弾性的に振る舞わず、永久変形するようになる応力の値を指す。
Our perception of an elastic material depends on both its elastic limit and its elastic modulus. For example, all rubbers are characterized by a low elastic modulus and a high elastic limit; hence, it is easy to stretch them and the stretch is noticeably large. Among materials with identical elastic limits, the most elastic is the one with the lowest elastic modulus.
英語のヒント
材料の弾性をどう感じるかは、弾性限界と弾性率の両方に依存する。例えばゴムは、いずれも弾性率が低く、弾性限界が高い。そのため、簡単に引き伸ばせ、伸びも目立って大きい。弾性限界が同じ材料同士では、弾性率が最も低いものを、最も弾力があると感じる。
When the load increases from zero, the resulting stress is in direct proportion to strain in the way given by Equation 12.33, but only when stress does not exceed some limiting value. For stress values within this linear limit, we can describe elastic behavior in analogy with Hooke’s law for a spring. According to Hooke’s law, the stretch value of a spring under an applied force is directly proportional to the magnitude of the force. Conversely, the response force from the spring to an applied stretch is directly proportional to the stretch. In the same way, the deformation of a material under a load is directly proportional to the load, and, conversely, the resulting stress is directly proportional to strain. The linearity limit (or the proportionality limit) is the largest stress value beyond which stress is no longer proportional to strain. Beyond the linearity limit, the relation between stress and strain is no longer linear. When stress becomes larger than the linearity limit but still within the elasticity limit, behavior is still elastic, but the relation between stress and strain becomes nonlinear.
英語のヒント
荷重をゼロから増すと、応力は式12.33のようにひずみに正比例する。ただし、応力がある限度を超えない場合に限られる。この線形な範囲では、ばねのフックの法則と同様に弾性の振る舞いを記述できる。フックの法則によれば、力を加えたばねの伸びは、力の大きさに正比例する。逆に、伸ばしたばねが返す力は、伸びに正比例する。同じように、荷重を受ける材料の変形は荷重に正比例し、その応力はひずみに正比例する。比例限界は、応力がひずみに比例する範囲の上限となる応力である。これを超えると、応力とひずみは線形関係ではなくなる。応力が比例限界を超えても弾性限界内にある場合、振る舞いは依然として弾性的だが、応力とひずみの関係は非線形になる。
For stresses beyond the elastic limit, a material exhibits plastic behavior. This means the material deforms irreversibly and does not return to its original shape and size, even when the load is removed. When stress is gradually increased beyond the elastic limit, the material undergoes plastic deformation. Rubber-like materials show an increase in stress with the increasing strain, which means they become more difficult to stretch and, eventually, they reach a fracture point where they break. Ductile materials such as metals show a gradual decrease in stress with the increasing strain, which means they become easier to deform as stress-strain values approach the breaking point. Microscopic mechanisms responsible for plasticity of materials are different for different materials.
英語のヒント
応力が弾性限界を超えると、材料は塑性的に振る舞う。つまり、変形が不可逆になり、荷重を取り除いても元の形と大きさに戻らない。応力を弾性限界を超えて徐々に増すと、塑性変形が進む。ゴムのような材料では、ひずみが増すにつれて応力も増す。つまり、だんだん引き伸ばしにくくなり、ついには破断点に達して切れる。金属のような延性材料では、ひずみが増すにつれて応力が徐々に減る。応力とひずみが破断点に近づくにつれ、変形しやすくなる。塑性を生む微視的な仕組みは、材料によって異なる。
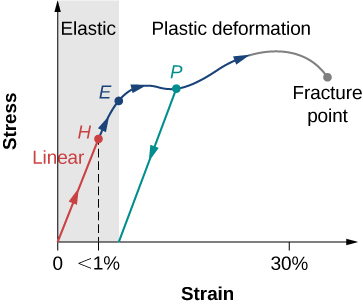
We can graph the relationship between stress and strain on a stress-strain diagram. Each material has its own characteristic strain-stress curve. A typical stress-strain diagram for a ductile metal under a load is shown in Figure 12.25. In this figure, strain is a fractional elongation (not drawn to scale). When the load is gradually increased, the linear behavior (red line) that starts at the no-load point (the origin) ends at the linearity limit at point H. For further load increases beyond point H, the stress-strain relation is nonlinear but still elastic. In the figure, this nonlinear region is seen between points H and E. Ever larger loads take the stress to the elasticity limit E, where elastic behavior ends and plastic deformation begins. Beyond the elasticity limit, when the load is removed, for example at P, the material relaxes to a new shape and size along the green line. This is to say that the material becomes permanently deformed and does not come back to its initial shape and size when stress becomes zero.
英語のヒント
応力とひずみの関係を、応力–ひずみ線図に描ける。それぞれの材料は、固有の曲線を持つ。図12.25は、荷重を受ける延性金属の典型的な応力–ひずみ線図である。この図でのひずみは、長さの伸びの割合であり、目盛りは実際の比率どおりには描いていない。荷重を徐々に増すと、無荷重の点(原点)から始まる線形の部分(赤線)は、H点の比例限界で終わる。H点を超えて荷重を増すと、応力とひずみの関係は非線形になるが、まだ弾性的である。図ではH点とE点の間がこの範囲に当たる。さらに荷重を増すと、応力は弾性限界Eに達し、弾性の振る舞いが終わって塑性変形が始まる。弾性限界を超えた、例えばP点で荷重を取り除くと、材料は緑の線に沿って、新たな形と大きさに落ち着く。つまり、永久変形が生じ、応力がゼロになっても、元の形と大きさには戻らない。
The material undergoes plastic deformation for loads large enough to cause stress to go beyond the elasticity limit at E. The material continues to be plastically deformed until the stress reaches the fracture point (breaking point). Beyond the fracture point, we no longer have one sample of material, so the diagram ends at the fracture point. For the completeness of this qualitative description, it should be said that the linear, elastic, and plasticity limits denote a range of values rather than one sharp point.
英語のヒント
応力がE点の弾性限界を超えるほど大きな荷重を加えると、材料は塑性変形する。その変形は、応力が破断点に達するまで続く。破断点を超えると、試料はもはや一つにつながっていないため、線図はそこで終わる。この定性的な説明を補うと、比例限界、弾性限界、塑性の限界は、厳密な一点ではなく、ある幅を持つ値を表している。
OpenStax / Rice University, University Physics Volume 1, CC BY 4.0. Source-book artwork retained. · CC BY 4.0 · Source出典

Figure 12.25図 12.25
Typical stress-strain plot for a metal under a load: The graph ends at the fracture point. The arrows show the direction of changes under an ever-increasing load. Points H and E are the linearity and elasticity limits, respectively. Between points H and E, the behavior is nonlinear. The green line originating at P illustrates the metal’s response when the load is removed. The permanent deformation has a strain value at the point where the green line intercepts the horizontal axis.
英語のヒント
荷重を受ける金属の典型的な応力–ひずみ線図。グラフは破断点で終わる。矢印は、荷重を増し続けたときの変化の向きを示す。H点とE点は、それぞれ比例限界と弾性限界であり、その間の振る舞いは非線形である。P点から始まる緑の線は、荷重を取り除いたときの金属の応答を示す。緑の線と横軸が交わる点のひずみが、永久変形の大きさを表す。
The value of stress at the fracture point is called breaking stress (or ultimate stress). Materials with similar elastic properties, such as two metals, may have very different breaking stresses. For example, ultimate stress for aluminum is and for steel it may be as high as depending on the kind of steel. We can make a quick estimate, based on Equation 12.34, that for rods with a cross-sectional area, the breaking load for an aluminum rod is and the breaking load for a steel rod is about nine times larger.
英語のヒント
破断点での応力を、破断応力(または極限応力)と呼ぶ。例えば二つの金属のように、弾性の性質が似た材料でも、破断応力は大きく異なることがある。アルミニウムの極限応力はだが、鋼では種類によってにも達する。式12.34から概算すると、断面積の棒では、アルミニウムの破断荷重はであり、鋼の破断荷重はその約9倍になる。