第10章二次方程式
10.5 Graphing Quadratic Equations in Two Variables10.5 2変数の二次方程式のグラフを描く
Learning Objectives学習目標
Learning Objectives学習目標
By the end of this section, you will be able to:
英語のヒント
この節を終えると、次のことができるようになる。
- Recognize the graph of a quadratic equation in two variables
英語のヒント
2変数の二次方程式のグラフを見分ける - Find the axis of symmetry and vertex of a parabola
英語のヒント
放物線の対称軸と頂点を求める - Find the intercepts of a parabola
英語のヒント
放物線と座標軸との交点を求める - Graph quadratic equations in two variables
英語のヒント
2変数の二次方程式のグラフを描く - Solve maximum and minimum applications
英語のヒント
最大・最小の応用問題を解く
Before You Begin (3)準備問題(3題)
Recognize the Graph of a Quadratic Equation in Two Variables2変数の二次方程式のグラフを見分ける
We have graphed equations of the form . We called equations like this linear equations because their graphs are straight lines.
英語のヒント
これまで の形の方程式のグラフを描いてきた。このような方程式を一次方程式と呼んだのは、そのグラフが直線だからである。
Now, we will graph equations of the form . We call this kind of equation a quadratic equation in two variables.
英語のヒント
ここでは の形の方程式のグラフを描く。この種類の方程式を2変数の二次方程式と呼ぶ。
Just like we started graphing linear equations by plotting points, we will do the same for quadratic equations.
英語のヒント
一次方程式のグラフを点を打つことから描き始めたのと同じように、二次方程式でもそうしていこう。
Let’s look first at graphing the quadratic equation . We will choose integer values of between and 2 and find their values. See Table 10.1.
英語のヒント
まず、二次方程式 のグラフを描く方法を見よう。 の値として から2までの整数を選び、対応する の値を求める。表10.1を参照。
0 |
0 |
1 |
1 |
1 |
|
2 |
4 |
4 |
|
Notice when we let and , we got the same value for .
英語のヒント
と のとき、 の値が同じになることに注目しよう。
The same thing happened when we let and .
英語のヒント
と のときにも、同じことが起こる。
Now, we will plot the points to show the graph of . See Figure 10.2.
英語のヒント
ここで点を打ち、 のグラフを示す。図10.2を参照。
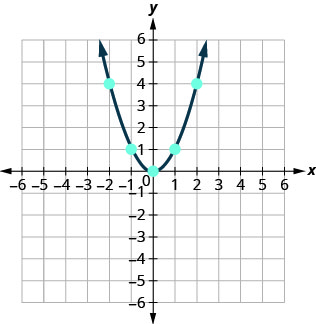
Figure 10.2図 10.2
The graph is not a line. This figure is called a parabola. Every quadratic equation has a graph that looks like this.
英語のヒント
このグラフは直線ではない。この図形を放物線と呼ぶ。どの二次方程式のグラフも、このような形になる。
In Example 10.43 you will practice graphing a parabola by plotting a few points.
英語のヒント
例10.43では、いくつかの点を打って放物線を描く練習をする。
Example 10.43例題 10.43
Graph .
英語のヒント
のグラフをかけ。
Solution解答
We will graph the equation by plotting points.
英語のヒント
点を打って方程式のグラフを描く。
Choose integers values for x, substitute them into the equation and solve for y. x の値として整数を選び、方程式に代入して y について解く。 |
||
Record the values of the ordered pairs in the chart. 順序対の値を表に記録する。 |
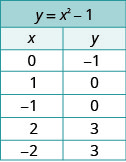 |
|
Plot the points, and then connect them with a smooth curve. The result will be the graph of the equation. 点を打ち、滑らかな曲線で結ぶ。これが方程式 のグラフになる。 |
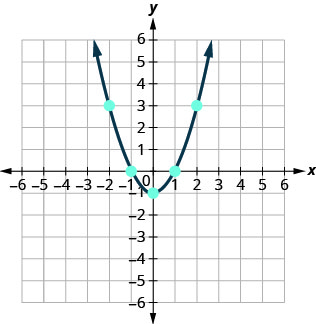 |
|
Try It (2)確認問題(2題)
How do the equations and differ? What is the difference between their graphs? How are their graphs the same?
英語のヒント
方程式 と はどこが違うか。そのグラフにはどのような違いがあるか。グラフのどこが同じか。
All parabolas of the form open upwards or downwards. See Figure 10.3.
英語のヒント
の形の放物線は、すべて上向きか下向きに開く。図10.3を参照。
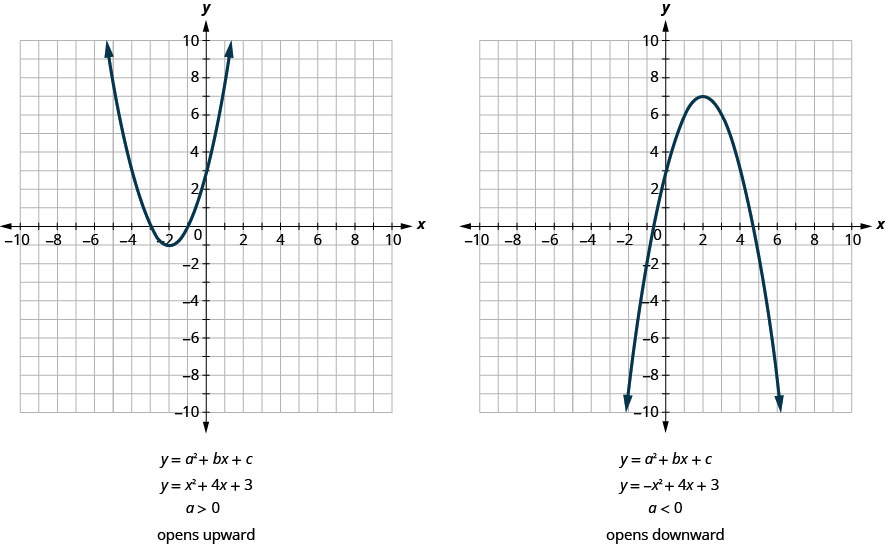
Figure 10.3図 10.3
Notice that the only difference in the two equations is the negative sign before the in the equation of the second graph in Figure 10.3. When the term is positive, the parabola opens upward, and when the term is negative, the parabola opens downward.
英語のヒント
二つの方程式の違いは、図10.3の2番目のグラフの方程式で の前に負号が付いていることだけである。 の項が正なら放物線は上向きに開き、 の項が負なら下向きに開く。
Example 10.44例題 10.44
Determine whether each parabola opens upward or downward:
英語のヒント
それぞれの放物線が上向きに開くか下向きに開くかを判定せよ。
ⓐ ⓑ
Solution解答
ⓐ Find the value of "a". ⓐ a の値を求める。 |
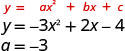 Since the “a” is negative, the parabola will open downward. a が負なので、放物線は下向きに開く。 |
|
ⓑ Find the value of "a". ⓑ a の値を求める。 |
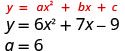 Since the “a” is positive, the parabola will open upward. a が正なので、放物線は上向きに開く。 |
|
Try It (2)確認問題(2題)
Find the Axis of Symmetry and Vertex of a Parabola放物線の対称軸と頂点を求める
Look again at Figure 10.3. Do you see that we could fold each parabola in half and that one side would lie on top of the other? The ‘fold line’ is a line of symmetry. We call it the axis of symmetry of the parabola.
英語のヒント
もう一度図10.3を見よう。どちらの放物線も半分に折ると、一方がもう一方に重なることがわかるだろうか。この「折り目の直線」が対称軸である。これを放物線の対称軸と呼ぶ。
We show the same two graphs again with the axis of symmetry in blue. See Figure 10.4.
英語のヒント
同じ二つのグラフをもう一度示し、対称軸を青で描いている。図10.4を参照。
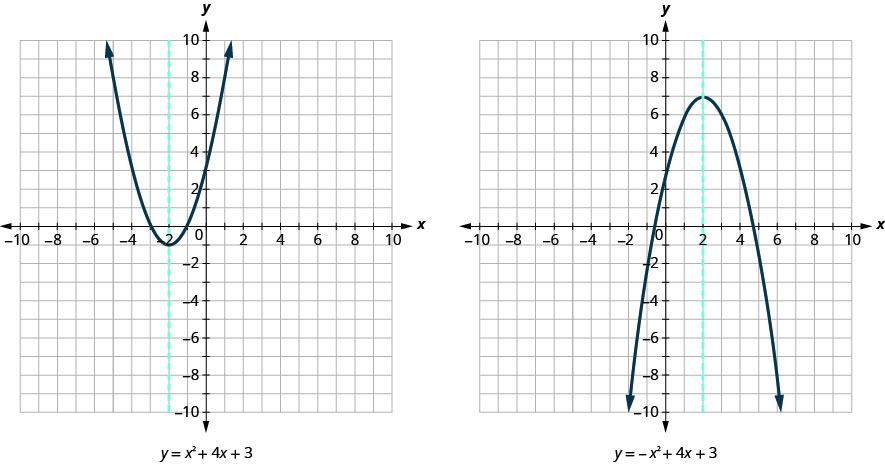
Figure 10.4図 10.4
The equation of the axis of symmetry can be derived by using the Quadratic Formula. We will omit the derivation here and proceed directly to using the result. The equation of the axis of symmetry of the graph of is
英語のヒント
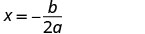
対称軸の方程式は解の公式を使って導ける。ここでは導出を省略し、結果を使うことに進む。 のグラフの対称軸の方程式は である。
So, to find the equation of symmetry of each of the parabolas we graphed above, we will substitute into the formula .
英語のヒント
したがって、上で描いたそれぞれの放物線の対称軸の方程式を求めるには、公式 に代入する。
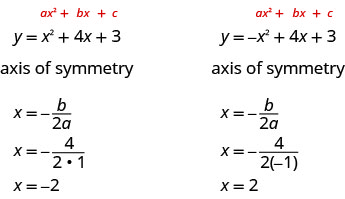
Look back at Figure 10.4. Are these the equations of the dashed red lines?
英語のヒント
図10.4を見返そう。これらは赤い破線の方程式になっているだろうか。
The point on the parabola that is on the axis of symmetry is the lowest or highest point on the parabola, depending on whether the parabola opens upwards or downwards. This point is called the vertex of the parabola.
英語のヒント
放物線上にあり対称軸上にもある点は、放物線が上向きに開くか下向きに開くかに応じて、放物線上の最も低い点か最も高い点になる。この点を放物線の頂点と呼ぶ。
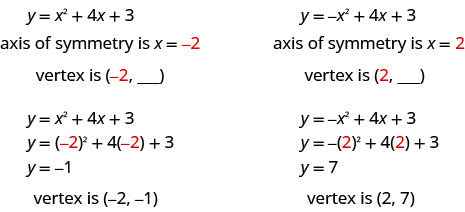
We can easily find the coordinates of the vertex, because we know it is on the axis of symmetry. This means its x-coordinate is . To find the y-coordinate of the vertex, we substitute the value of the x-coordinate into the quadratic equation.
英語のヒント
頂点は対称軸上にあるとわかっているので、その座標は簡単に求められる。つまり、頂点のx座標は である。頂点のy座標を求めるには、x座標の値を二次方程式に代入する。
Example 10.45例題 10.45
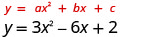
For the parabola find: ⓐ the axis of symmetry and ⓑ the vertex.
英語のヒント
放物線 について、ⓐ 対称軸、ⓑ 頂点を求めよ。
Solution解答
ⓐ |
 |
|
The axis of symmetry is the line . 対称軸は直線 である。 |
 |
|
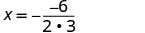
Substitute the values of a, b into the equation. a、b の値を式に代入する。 |
 |
|
Simplify. 簡単にする。 |
||
The axis of symmetry is the line . 対称軸は直線 である。 |
||
ⓑ |
 |
|
The vertex is on the line of symmetry, so its x-coordinate will be . 頂点は対称軸上にあるので、そのx座標は になる。 |
||
Substitute into the equation and solve for y. を方程式に代入し、y について解く。 |
 |
|
Simplify. 簡単にする。 |
 |
|
This is the y-coordinate. これがy座標である。 |
The vertex is 頂点は である。 |
|