第4章グラフ
4.2 Graph Linear Equations in Two Variables4.2 2変数の一次方程式のグラフを描く
Learning Objectives学習目標
Learning Objectives学習目標
By the end of this section, you will be able to:
英語のヒント
この節を終えると、次のことができるようになる。
- Recognize the relationship between the solutions of an equation and its graph
英語のヒント
方程式の解とグラフの関係を理解する - Graph a linear equation by plotting points
英語のヒント
点を取って一次方程式のグラフを描く - Graph vertical and horizontal lines
英語のヒント
垂直な直線と水平な直線を描く
Before You Begin (2)準備問題(2題)
Recognize the Relationship Between the Solutions of an Equation and its Graph方程式の解とグラフの関係を理解する
In the previous section, we found several solutions to the equation . They are listed in Table 4.11. So, the ordered pairs , , and are some solutions to the equation . We can plot these solutions in the rectangular coordinate system as shown in Figure 4.5.
英語のヒント
0 |
3 |
|
2 |
0 |
|
1 |
||
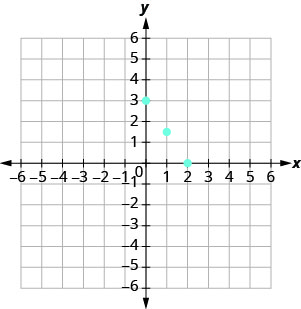
Figure 4.5図 4.5
Notice how the points line up perfectly? We connect the points with a line to get the graph of the equation . See Figure 4.6. Notice the arrows on the ends of each side of the line. These arrows indicate the line continues.
英語のヒント
点が完全に一直線上に並んでいることに気付くだろうか。点を線で結ぶと、方程式のグラフが得られる。図4.6を参照する。直線の両端の矢印に注目しよう。矢印は、直線がその先も続くことを表す。
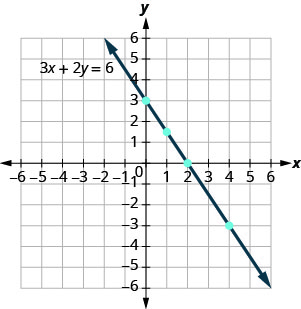
Figure 4.6図 4.6
Every point on the line is a solution of the equation. Also, every solution of this equation is a point on this line. Points not on the line are not solutions.
英語のヒント
直線上のすべての点は、方程式の解である。また、この方程式のすべての解は、この直線上の点になる。直線上にない点は、解ではない。
Notice that the point whose coordinates are is on the line shown in Figure 4.7. If you substitute and into the equation, you find that it is a solution to the equation.
英語のヒント
座標がの点は、図4.7の直線上にある。とを方程式に代入すると、解であることが分かる。
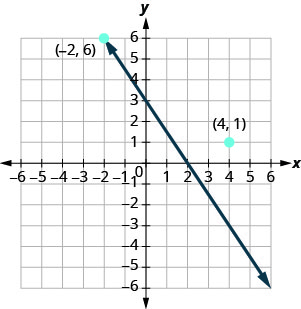
Figure 4.7図 4.7
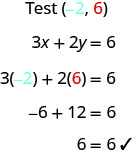
So the point is a solution to the equation . (The phrase “the point whose coordinates are ” is often shortened to “the point .”)
英語のヒント
したがって、点は方程式の解である。「座標がの点」という表現は、しばしば「点」と短く言う。
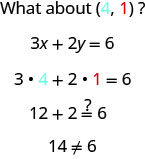
So is not a solution to the equation . Therefore, the point is not on the line. See Figure 4.6. This is an example of the saying, “A picture is worth a thousand words.” The line shows you all the solutions to the equation. Every point on the line is a solution of the equation. And, every solution of this equation is on this line. This line is called the graph of the equation .
英語のヒント
したがって、は方程式の解ではない。そのため、点は直線上にない。図4.6を参照する。これは「1枚の絵は千の言葉に値する」ということわざの一例である。直線は方程式のすべての解を示す。直線上のすべての点が方程式の解であり、この方程式のすべての解がこの直線上にある。この直線を、方程式のグラフという。
Example 4.10例題 4.10
The graph of is shown.
英語のヒント
のグラフを示す。
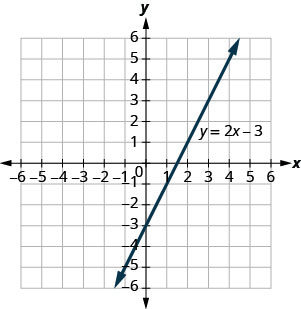
For each ordered pair, decide:
英語のヒント
各順序対について、次のことを判定する:
ⓐ Is the ordered pair a solution to the equation?
ⓑ Is the point on the line?
ⓑ Is the point on the line?
英語のヒント
ⓐ 方程式の解であるか。ⓑ 点が直線上にあるか。
A B C D
Solution解答
Substitute the x- and y- values into the equation to check if the ordered pair is a solution to the equation.
英語のヒント
xとyの値を方程式に代入して、順序対が解かどうかを確かめる。
- ⓐ
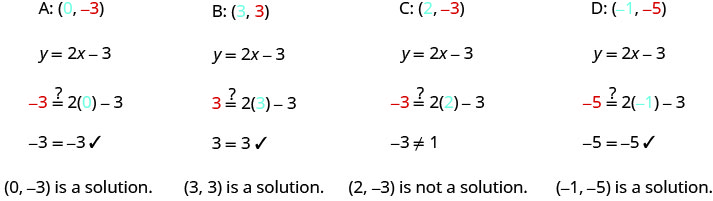
- ⓑ Plot the points A , B , C , and D .
英語のヒント
ⓑ 点A 、B 、C 、D をとる。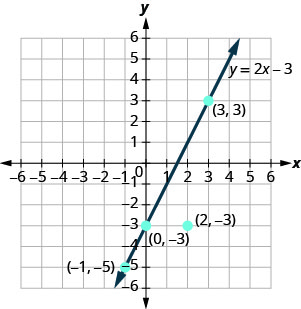
The points , , and are on the line , and the point is not on the line.
英語のヒント
点、、は直線上にあるが、点は直線上にない。
The points that are solutions to are on the line, but the point that is not a solution is not on the line.
英語のヒント
の解となる点は直線上にあるが、解でない点は直線上にない。
Try It (2)確認問題(2題)
Graph a Linear Equation by Plotting Points点を取って一次方程式のグラフを描く
There are several methods that can be used to graph a linear equation. The method we used to graph is called plotting points, or the Point–Plotting Method.
英語のヒント
一次方程式のグラフを描く方法はいくつかある。のグラフを描くために使った方法を、点をとる方法、または点描法という。
Example 4.11例題 4.11
How To Graph an Equation By Plotting Points点をとって方程式のグラフを描く方法
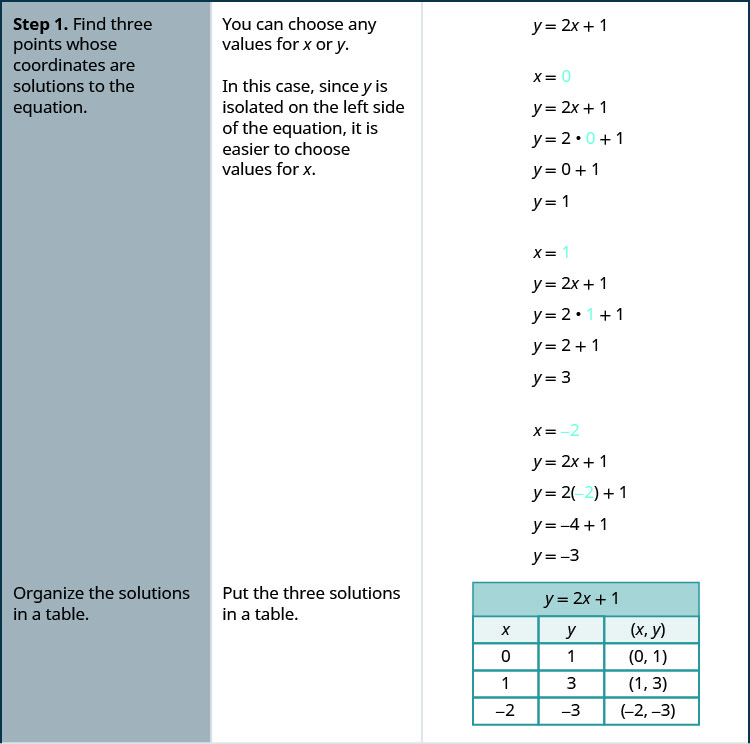
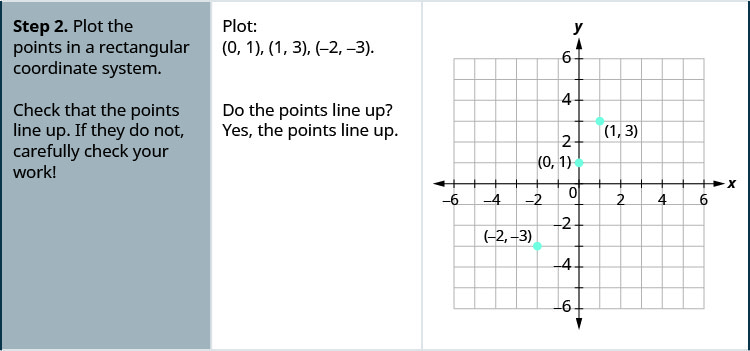
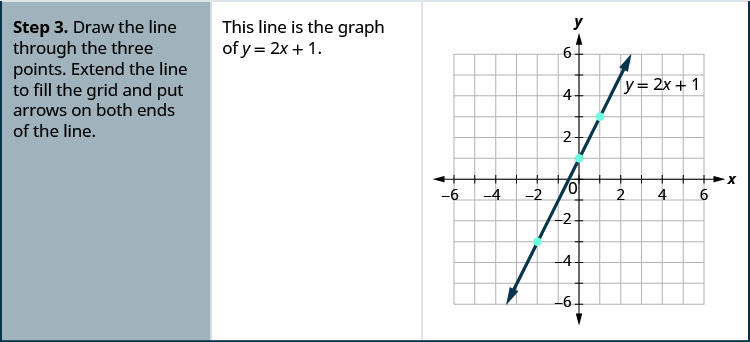
Graph the equation by plotting points.
英語のヒント
点をとって、方程式のグラフを描く。
Solution解答
Try It (2)確認問題(2題)
The steps to take when graphing a linear equation by plotting points are summarized below.
英語のヒント
点をとって一次方程式のグラフを描く手順を、以下にまとめる。
It is true that it only takes two points to determine a line, but it is a good habit to use three points. If you only plot two points and one of them is incorrect, you can still draw a line but it will not represent the solutions to the equation. It will be the wrong line.
英語のヒント
直線を決めるには2点で十分だが、3点を使う習慣を付けるとよい。2点だけをとって片方が間違っていても直線は描けるが、それは方程式の解を表さない。間違った直線になってしまう。
If you use three points, and one is incorrect, the points will not line up. This tells you something is wrong and you need to check your work. Look at the difference between part (a) and part (b) in Figure 4.8.
英語のヒント
3点を使えば、1点が間違っていると一直線上に並ばない。どこかに間違いがあり、計算を確認する必要があると分かる。図4.8の(a)と(b)の違いを見てみよう。
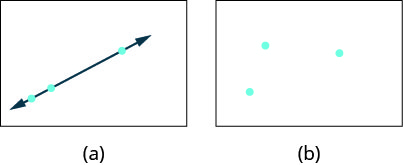
Figure 4.8図 4.8
Let’s do another example. This time, we’ll show the last two steps all on one grid.
英語のヒント
もう1つ例題を見てみよう。今度は最後の2つの手順を、1枚の格子上にまとめて示す。
Example 4.12例題 4.12
Graph the equation .
英語のヒント
方程式のグラフを描く。
Solution解答
Solution解答
Find three points that are solutions to the equation. Here, again, it’s easier to choose values for . Do you see why?
英語のヒント
方程式の解となる点を3つ求める。ここでもの値を選ぶほうが簡単である。なぜか分かるだろうか。
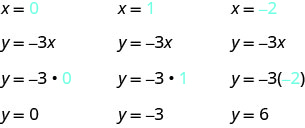
0 |
0 |
|
1 |
||
6 |
||
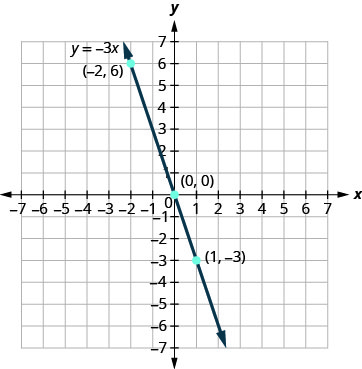
Plot the points, check that they line up, and draw the line.
英語のヒント
点をとり、一直線上に並ぶことを確かめて、直線を描く。
Try It (2)確認問題(2題)
When an equation includes a fraction as the coefficient of , we can still substitute any numbers for . But the math is easier if we make ‘good’ choices for the values of . This way we will avoid fraction answers, which are hard to graph precisely.
英語のヒント
方程式での係数が分数でも、には好きな数を代入できる。ただし、の値をうまく選ぶと計算が簡単になる。こうすれば、正確にグラフにとりにくい分数の答えを避けられる。
Example 4.13例題 4.13
Graph the equation .
英語のヒント
方程式のグラフを描く。
Solution解答
Find three points that are solutions to the equation. Since this equation has the fraction as a coefficient of we will choose values of carefully. We will use zero as one choice and multiples of 2 for the other choices. Why are multiples of 2 a good choice for values of ?
英語のヒント
方程式の解となる点を3つ求める。この方程式ではの係数が分数なので、の値を注意して選ぶ。1つは0にし、ほかは2の倍数にする。の値として2の倍数がよいのはなぜだろうか。
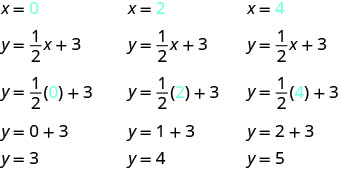
0 |
3 |
|
2 |
4 |
|
4 |
5 |
|
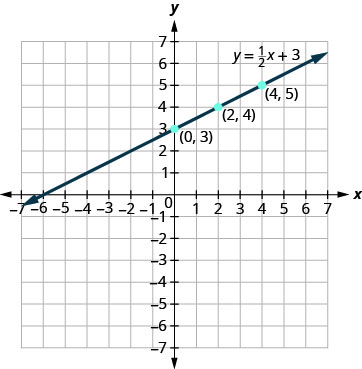
Plot the points, check that they line up, and draw the line.
英語のヒント
点をとり、一直線上に並ぶことを確かめて、直線を描く。
Try It (2)確認問題(2題)
So far, all the equations we graphed had given in terms of . Now we’ll graph an equation with and on the same side. Let’s see what happens in the equation . If what is the value of ?
英語のヒント
ここまで描いた方程式のグラフでは、すべてがを使って表されていた。今度はとが同じ辺にある方程式のグラフを描く。方程式ではどうなるかを見てみよう。なら、の値はいくつか。
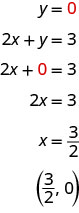
This point has a fraction for the x- coordinate and, while we could graph this point, it is hard to be precise graphing fractions. Remember in the example , we carefully chose values for so as not to graph fractions at all. If we solve the equation for , it will be easier to find three solutions to the equation.
英語のヒント
この点のx座標は分数であり、グラフにとることはできるが、分数を正確にとるのは難しい。の例では、分数をとらずに済むようにの値を注意して選んだ。方程式をについて解けば、3つの解を求めやすくなる。
The solutions for , , and are shown in the Table 4.14. The graph is shown in Figure 4.9.
英語のヒント
0 |
3 |
|
1 |
1 |
|
5 |
||
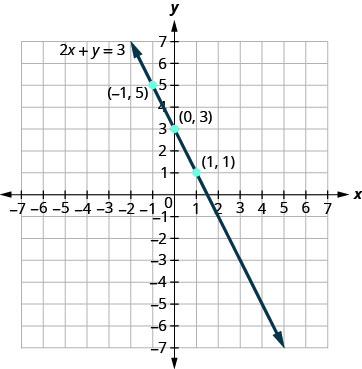
Figure 4.9図 4.9
Can you locate the point , which we found by letting , on the line?
英語のヒント
として求めた点を、直線上で見つけられるだろうか。
Example 4.14例題 4.14
Graph the equation .
英語のヒント
方程式のグラフを描く。
Solution解答
Find three points that are solutions to the equation. 方程式の解となる点を3つ求める。 |
|
First, solve the equation for . まず、方程式をについて解く。 |
We’ll let be 0, 1, and to find 3 points. The ordered pairs are shown in Table 4.16. Plot the points, check that they line up, and draw the line. See Figure 4.10.
英語のヒント
0 |
||
1 |
||
2 |
||
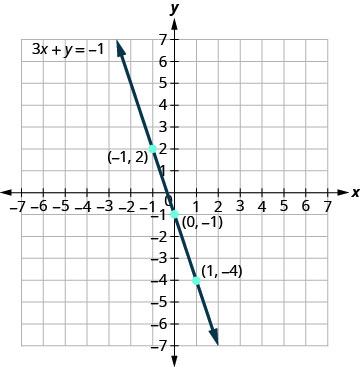
Figure 4.10図 4.10
Try It (2)確認問題(2題)
If you can choose any three points to graph a line, how will you know if your graph matches the one shown in the answers in the book? If the points where the graphs cross the x- and y-axes are the same, the graphs match!
英語のヒント
グラフを描くのに好きな3点を選べるなら、描いたグラフが本の解答のものと一致するか、どうやって確かめるのだろうか。x軸とy軸を横切る点がそれぞれ同じなら、グラフは一致する。
The equation in Example 4.14 was written in standard form, with both and on the same side. We solved that equation for in just one step. But for other equations in standard form it is not that easy to solve for , so we will leave them in standard form. We can still find a first point to plot by letting and solving for . We can plot a second point by letting and then solving for . Then we will plot a third point by using some other value for or .
英語のヒント
例題4.14の方程式は、とが同じ辺にある標準形だった。この方程式は、1つの手順でについて解けた。しかし、標準形の方程式の中には、について簡単には解けないものもあるので、標準形のままにしておく。それでも、としてについて解けば、最初の点を求められる。2つ目はとしてについて解いて求める。その後、またはの別の値を使って3つ目の点をとる。
Example 4.15例題 4.15
Graph the equation .
英語のヒント
方程式のグラフを描く。
Solution解答
Find three points that are solutions to the equation. 方程式の解となる点を3つ求める。 |
|
First, let . まずとおく。 |
|
Solve for . について解く。 |
|
Now let . 今度はとおく。 |
|
Solve for . について解く。 |
|
We need a third point. Remember, we can choose any value for or . We'll let . 3つ目の点が必要である。やには好きな値を選べる。としよう。 |
|
Solve for . について解く。 |
We list the ordered pairs in Table 4.18. Plot the points, check that they line up, and draw the line. See Figure 4.11.
英語のヒント
0 |
||
3 |
0 |
|
6 |
2 |
|
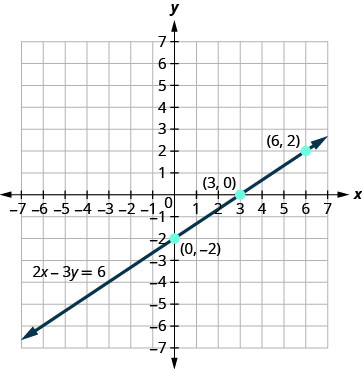
Figure 4.11図 4.11