第4章グラフ
Introductionはじめに
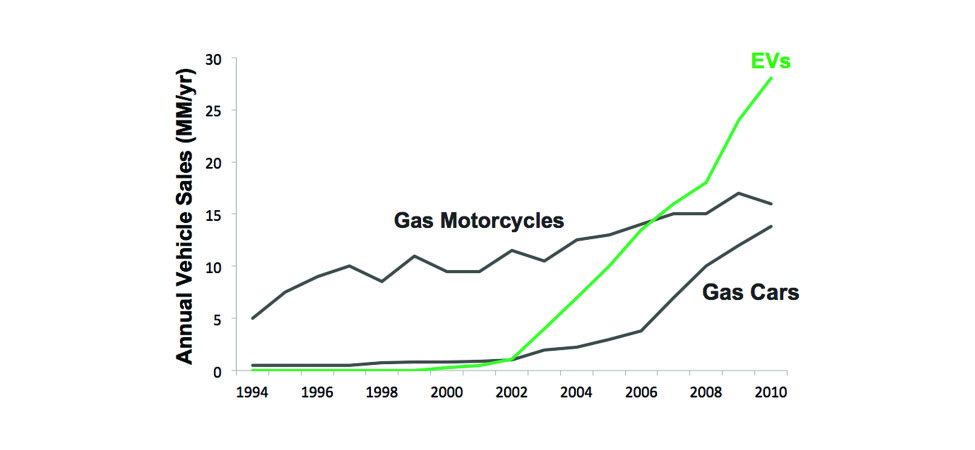
Steve Jurvetson, Where in the world is this?, Flickr, CC BY 2.0. Adapted in OpenStax Elementary Algebra 2e. · CC BY 2.0 · Source出典
Figure 4.1図 4.1
This graph illustrates the annual vehicle sales of gas motorcycles, gas cars, and electric vehicles from 1994 to 2010. It is a line graph with x- and y-axes, one of the most common types of graphs. (credit: Steve Jurvetson, Flickr)
英語のヒント
1994年から2010年までの、ガソリン二輪車、ガソリン自動車、電気自動車の年間販売台数を示すグラフ。x軸とy軸のある折れ線グラフで、最もよく使われるグラフの1つである。(出典:Steve Jurvetson、Flickr)
Graphs are found in all areas of our lives—from commercials showing you which cell phone carrier provides the best coverage, to bank statements and news articles, to the boardroom of major corporations. In this chapter, we will study the rectangular coordinate system, which is the basis for most consumer graphs. We will look at linear graphs, slopes of lines, equations of lines, and linear inequalities.
英語のヒント
どの携帯電話会社が最も広い通信範囲を提供するかを示す広告から、銀行の明細やニュース記事、大企業の会議室まで、グラフは生活のあらゆる所にある。この章では、一般の人が見るグラフの多くの基礎となる、直交座標系を学ぶ。直線のグラフ、傾き、直線の方程式、一次不等式を見ていく。