第4章グラフ
4.7 Graphs of Linear Inequalities4.7 一次不等式のグラフ
Learning Objectives学習目標
Learning Objectives学習目標
By the end of this section, you will be able to:
英語のヒント
この節を終えると、次のことができるようになる。
- Verify solutions to an inequality in two variables
英語のヒント
2変数の不等式の解を確かめる - Recognize the relation between the solutions of an inequality and its graph
英語のヒント
不等式の解とグラフの関係を理解する - Graph linear inequalities
英語のヒント
一次不等式のグラフを描く
Before You Begin (3)準備問題(3題)
Verify Solutions to an Inequality in Two Variables2変数の不等式の解を確かめる
We have learned how to solve inequalities in one variable. Now, we will look at inequalities in two variables. Inequalities in two variables have many applications. If you ran a business, for example, you would want your revenue to be greater than your costs—so that your business would make a profit.
英語のヒント
1変数の不等式を解く方法を学んだ。次に、2変数の不等式を見る。2変数の不等式には多くの応用がある。たとえば事業を営むなら、利益が出るように、収入が費用を上回ることを望むだろう。
Do you remember that an inequality with one variable had many solutions? The solution to the inequality is any number greater than 3. We showed this on the number line by shading in the number line to the right of 3, and putting an open parenthesis at 3. See Figure 4.30.
英語のヒント
1変数の不等式には多くの解があったことを覚えているだろうか。不等式の解は、3より大きいあらゆる数である。数直線では、3の右側に色を付け、3の位置に丸括弧を置いて表した。図4.30を参照する。

Figure 4.30図 4.30
Similarly, inequalities in two variables have many solutions. Any ordered pair that makes the inequality true when we substitute in the values is a solution of the inequality.
英語のヒント
同様に、2変数の不等式にも多くの解がある。値を代入したときに不等式を真にする順序対は、どれもその不等式の解である。
Example 4.69例題 4.69
Determine whether each ordered pair is a solution to the inequality :
英語のヒント
それぞれの順序対が不等式の解かどうかを判定する:
ⓐ ⓑ ⓒ ⓓ ⓔ
Solution解答
- ⓐ


 Simplify.簡単にする。
So, is not a solution to .したがって、はの解ではない。 - ⓑ


 Simplify.簡単にする。
So, is a solution to .したがって、はの解である。 - ⓒ


 Simplify.簡単にする。
So, is not a solution to .したがって、はの解ではない。 - ⓓ


 Simplify.簡単にする。
So, is not a solution to .したがって、はの解ではない。 - ⓔ


 Simplify.簡単にする。
So, is a solution to .したがって、はの解である。
Try It (2)確認問題(2題)
Recognize the Relation Between the Solutions of an Inequality and its Graph不等式の解とグラフの関係を理解する
Now, we will look at how the solutions of an inequality relate to its graph.
英語のヒント
次に、不等式の解がグラフとどう関係するかを見ていく。
Let’s think about the number line in Figure 4.30 again. The point separated that number line into two parts. On one side of 3 are all the numbers less than 3. On the other side of 3 all the numbers are greater than 3. See Figure 4.31.
英語のヒント

Figure 4.31図 4.31
The solution to is the shaded part of the number line to the right of .
英語のヒント
の解は、数直線のより右側の色が付いた部分である。
Similarly, the line separates the plane into two regions. On one side of the line are points with . On the other side of the line are the points with . We call the line a boundary line.
英語のヒント
同様に、直線は平面を2つの領域に分ける。直線の一方の側にはを満たす点があり、もう一方の側にはを満たす点がある。直線を境界線という。
For an inequality in one variable, the endpoint is shown with a parenthesis or a bracket depending on whether or not is included in the solution:
英語のヒント
1変数の不等式では、が解に含まれるかどうかによって、端点を丸括弧または角括弧で示す:

Similarly, for an inequality in two variables, the boundary line is shown with a solid or dashed line to indicate whether or not it the line is included in the solution. This is summarized in Table 4.49
英語のヒント
同様に、2変数の不等式では、境界線が解に含まれるかどうかを、実線と破線で示す。表4.49にまとめる。
Boundary line is not included in solution. 境界線は解に含まれない。 |
Boundary line is included in solution. 境界線は解に含まれる。 |
Boundary line is dashed. 境界線は破線である。 |
Boundary line is solid. 境界線は実線である。 |
Now, let’s take a look at what we found in Example 4.69. We’ll start by graphing the line , and then we’ll plot the five points we tested. See Figure 4.32.
英語のヒント
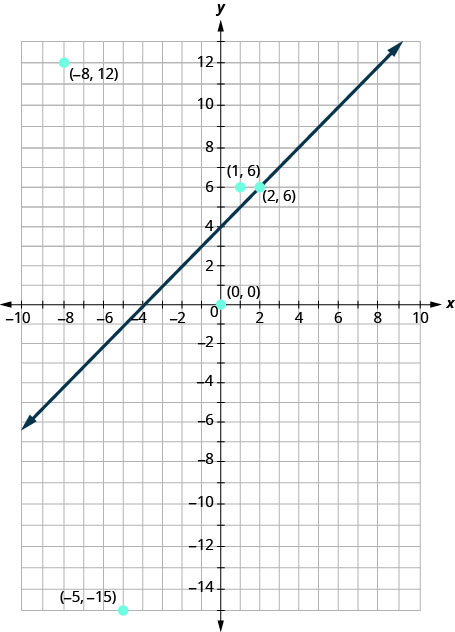
Figure 4.32図 4.32
In Example 4.69 we found that some of the points were solutions to the inequality and some were not.
英語のヒント
例題4.69では、不等式の解になる点と、ならない点があることがわかった。
Which of the points we plotted are solutions to the inequality ? The points and are solutions to the inequality . Notice that they are both on the same side of the boundary line .
英語のヒント
とった点のうち、どれが不等式の解か。点とは、不等式の解である。両方とも境界線の同じ側にあることに注目する。
The two points and are on the other side of the boundary line , and they are not solutions to the inequality . For those two points, .
英語のヒント
2点とは境界線の反対側にあり、不等式の解ではない。この2点では、である。
What about the point ? Because , the point is a solution to the equation . So the point is on the boundary line.
英語のヒント
点はどうか。なので、方程式の解である。したがって、点は境界線上にある。
Let’s take another point on the left side of the boundary line and test whether or not it is a solution to the inequality . The point clearly looks to be to the left of the boundary line, doesn’t it? Is it a solution to the inequality?
英語のヒント
境界線の左側に別の点をとり、不等式の解かどうか調べよう。点は、明らかに境界線の左側に見えるだろう。この点は不等式の解だろうか。
Any point you choose on the left side of the boundary line is a solution to the inequality . All points on the left are solutions.
英語のヒント
境界線の左側の点は、どれを選んでも不等式の解である。左側の点は、すべて解である。
Similarly, all points on the right side of the boundary line, the side with and , are not solutions to . See Figure 4.33.
英語のヒント
同様に、境界線の右側、つまりとがある側の点は、どれもの解ではない。図4.33を参照する。
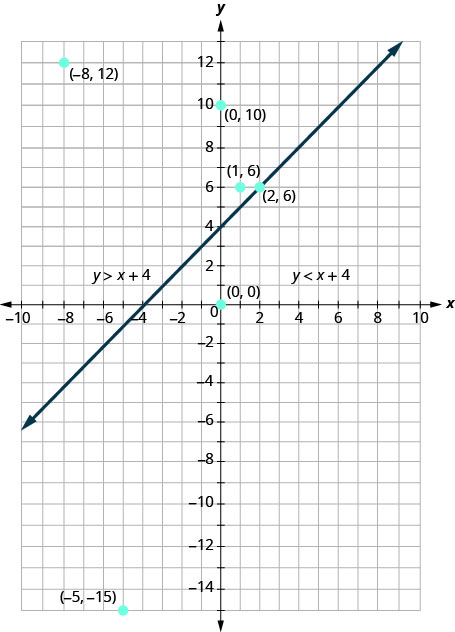
Figure 4.33図 4.33
The graph of the inequality is shown in Figure 4.34 below. The line divides the plane into two regions. The shaded side shows the solutions to the inequality .
英語のヒント
不等式のグラフを、下の図4.34に示す。直線は平面を2つの領域に分ける。色が付いた側が、不等式の解を示す。
The points on the boundary line, those where , are not solutions to the inequality , so the line itself is not part of the solution. We show that by making the line dashed, not solid.
英語のヒント
境界線上の点、つまりを満たす点は、不等式の解ではないので、直線自体は解に含まれない。それを、実線ではなく破線にして示す。
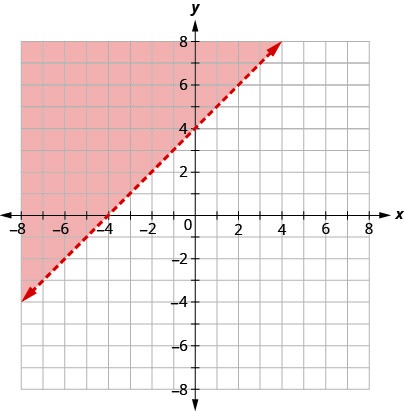
Figure 4.34図 4.34
The graph of the inequality .
英語のヒント
不等式のグラフ。
Example 4.70例題 4.70
The boundary line shown is . Write the inequality shown by the graph.
英語のヒント
図の境界線はである。グラフが表す不等式を書け。
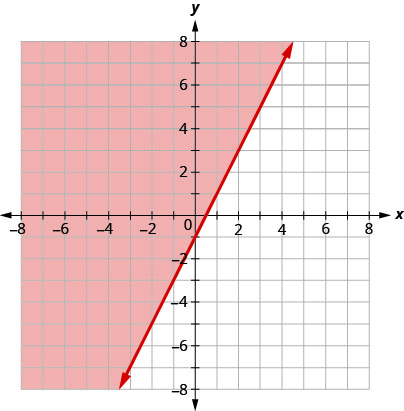
Solution解答
The line is the boundary line. On one side of the line are the points with and on the other side of the line are the points with .
英語のヒント
直線が境界線である。一方の側にはを満たす点があり、もう一方の側にはを満たす点がある。
Let’s test the point and see which inequality describes its side of the boundary line.
英語のヒント
点を調べ、その点がある境界線の側をどちらの不等式が表すか確かめよう。
At , which inequality is true:
英語のヒント
では、どちらの不等式が真か:
Since, is true, the side of the line with , is the solution. The shaded region shows the solution of the inequality .
英語のヒント
が真なので、を含む側が解である。色の付いた領域は、不等式の解を示す。
Since the boundary line is graphed with a solid line, the inequality includes the equal sign.
英語のヒント
境界線が実線で描かれているので、不等号には等号が含まれる。
The graph shows the inequality .
英語のヒント
グラフは不等式を示す。
We could use any point as a test point, provided it is not on the line. Why did we choose ? Because it’s the easiest to evaluate. You may want to pick a point on the other side of the boundary line and check that .
英語のヒント
直線上でなければ、どの点を調べてもよい。を選んだのはなぜか。値を求めるのが最も簡単だからである。境界線の反対側の点を選び、になることを確かめてみてもよい。
Try It (2)確認問題(2題)
Example 4.71例題 4.71
The boundary line shown is . Write the inequality shown by the graph.
英語のヒント
図の境界線はである。グラフが表す不等式を書け。
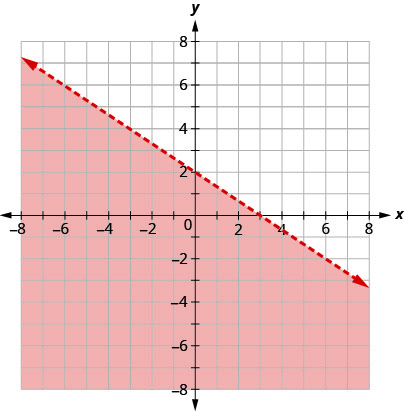
Solution解答
The line is the boundary line. On one side of the line are the points with and on the other side of the line are the points with .
英語のヒント
直線が境界線である。一方の側にはを満たす点があり、もう一方の側にはを満たす点がある。
Let’s test the point and see which inequality describes its side of the boundary line.
英語のヒント
点を調べ、その点がある境界線の側をどちらの不等式が表すか確かめよう。
At , which inequality is true:
英語のヒント
では、どちらの不等式が真か:
So the side with is the side where .
英語のヒント
したがって、を含む側はとなる側である。
(You may want to pick a point on the other side of the boundary line and check that .)
英語のヒント
(境界線の反対側の点を選び、になることを確かめてみてもよい。)
Since the boundary line is graphed as a dashed line, the inequality does not include an equal sign.
英語のヒント
境界線が破線で描かれているので、不等号には等号が含まれない。
The graph shows the solution to the inequality .
英語のヒント
グラフは不等式の解を示す。