第4章グラフ
Graph Vertical and Horizontal Lines垂直な直線と水平な直線を描く
Can we graph an equation with only one variable? Just and no , or just without an ? How will we make a table of values to get the points to plot?
英語のヒント
変数が1つだけの方程式でも、グラフを描けるだろうか。だけでがない場合や、だけでがない場合はどうか。点をとるための値の表を、どうやって作ればよいだろうか。
Let’s consider the equation . This equation has only one variable, . The equation says that is always equal to , so its value does not depend on . No matter what is, the value of is always .
英語のヒント
方程式を考えよう。変数はの1つだけである。この式はが常にに等しいと述べているので、その値はによらない。がいくつでも、の値は常にである。
So to make a table of values, write in for all the values. Then choose any values for . Since does not depend on , you can choose any numbers you like. But to fit the points on our coordinate graph, we’ll use 1, 2, and 3 for the y-coordinates. See Table 4.19.
英語のヒント
そこで表を作るには、の値をすべてと書く。次にの値を好きに選ぶ。はによらないので、どのような数を選んでもよい。ここではグラフの範囲に収まるように、y座標を1、2、3にする。表4.19を参照する。
1 |
||
2 |
||
3 |
||
Plot the points from Table 4.19 and connect them with a straight line. Notice in Figure 4.12 that we have graphed a vertical line.
英語のヒント
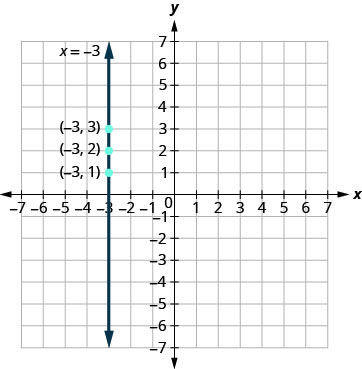
Figure 4.12図 4.12
Example 4.16例題 4.16
Graph the equation .
英語のヒント
方程式のグラフを描く。
Solution解答
The equation has only one variable, , and is always equal to 2. We create Table 4.20 where is always 2 and then put in any values for . The graph is a vertical line passing through the x-axis at 2. See Figure 4.13.
英語のヒント
2 |
1 |
|
2 |
2 |
|
2 |
3 |
|
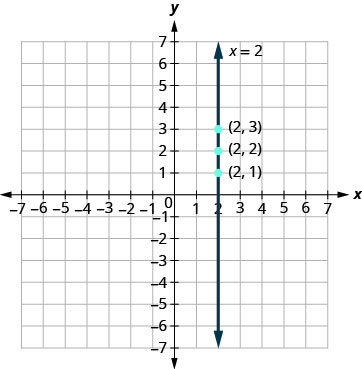
Figure 4.13図 4.13
Try It (2)確認問題(2題)
What if the equation has but no ? Let’s graph the equation . This time the y- value is a constant, so in this equation, does not depend on . Fill in 4 for all the ’s in Table 4.21 and then choose any values for . We’ll use 0, 2, and 4 for the x-coordinates.
英語のヒント
方程式にはあるががない場合はどうだろうか。のグラフを描こう。今度はyの値が定数なので、はによらない。表4.21のにすべて4を入れ、には好きな値を選ぶ。x座標には0、2、4を使う。
0 |
4 |
|
2 |
4 |
|
4 |
4 |
|
The graph is a horizontal line passing through the y-axis at 4. See Figure 4.14.
英語のヒント
グラフは、y軸上の4を通る水平な直線になる。図4.14を参照する。
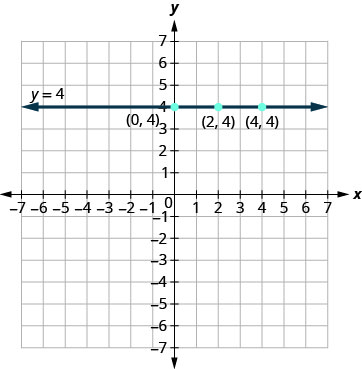
Figure 4.14図 4.14
Example 4.17例題 4.17
Graph the equation
英語のヒント
方程式のグラフを描く。
Solution解答
The equation has only one variable, . The value of is constant. All the ordered pairs in Table 4.22 have the same y-coordinate. The graph is a horizontal line passing through the y-axis at , as shown in Figure 4.15.
英語のヒント
0 |
||
3 |
||
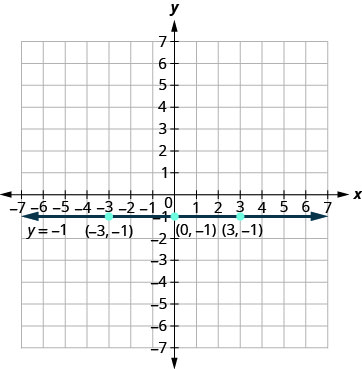
Figure 4.15図 4.15
Try It (2)確認問題(2題)
The equations for vertical and horizontal lines look very similar to equations like What is the difference between the equations and ?
英語のヒント
垂直な直線と水平な直線の方程式は、のような式とよく似ている。方程式との違いは何だろうか。
The equation has both and . The value of depends on the value of . The y-coordinate changes according to the value of . The equation has only one variable. The value of is constant. The y-coordinate is always 4. It does not depend on the value of . See Table 4.23.
英語のヒント
方程式にはとの両方がある。の値はの値によって決まる。y座標はの値に応じて変化する。方程式の変数は1つだけであり、の値は一定である。y座標は常に4で、の値にはよらない。表4.23を参照する。
0 |
0 |
0 |
4 |
|||
1 |
4 |
1 |
4 |
|||
2 |
8 |
2 |
4 |
|||
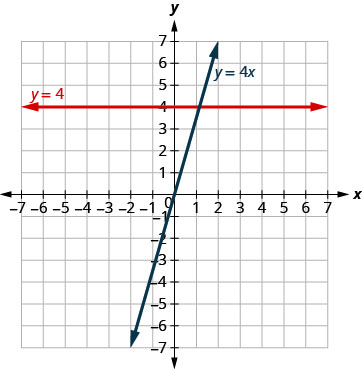
Figure 4.16図 4.16
Notice, in Figure 4.16, the equation gives a slanted line, while gives a horizontal line.
英語のヒント
図4.16では、方程式が斜めの直線を、が水平な直線を与えることに注目する。
Example 4.18例題 4.18
Graph and in the same rectangular coordinate system.
英語のヒント
同じ直交座標平面に、とのグラフを描く。
Solution解答
Notice that the first equation has the variable , while the second does not. See Table 4.24. The two graphs are shown in Figure 4.17.
英語のヒント
0 |
0 |
0 |
||||
1 |
1 |
|||||
2 |
2 |
|||||
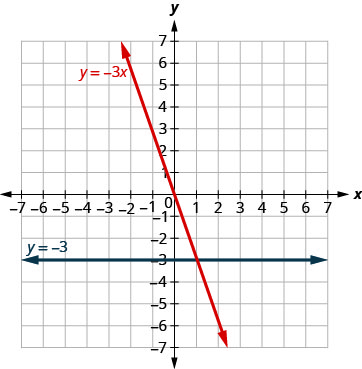
Figure 4.17図 4.17