第4章グラフ
Graph a Line Using its Slope and Intercept傾きと切片を使って直線のグラフを描く
Now that we know how to find the slope and y-intercept of a line from its equation, we can graph the line by plotting the y-intercept and then using the slope to find another point.
英語のヒント
方程式から直線の傾きとy切片を求める方法がわかったので、y切片をとり、傾きを使って別の点を求めることで、直線のグラフを描ける。
Example 4.43例題 4.43
How to Graph a Line Using its Slope and Intercept傾きと切片を使って直線のグラフを描く方法
Graph the line of the equation using its slope and y-intercept.
英語のヒント
傾きとy切片を使って、方程式の直線を描く。
Solution解答


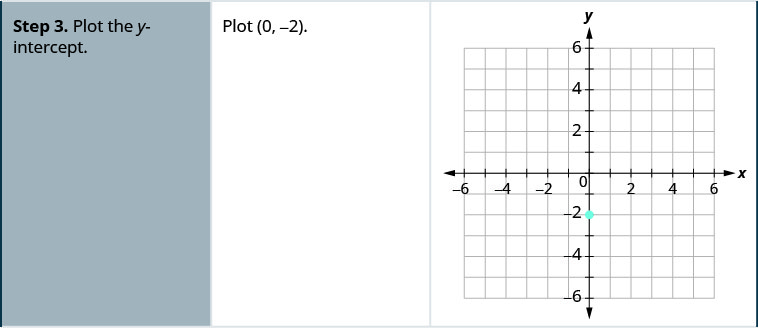
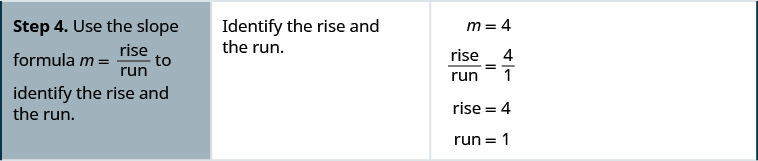
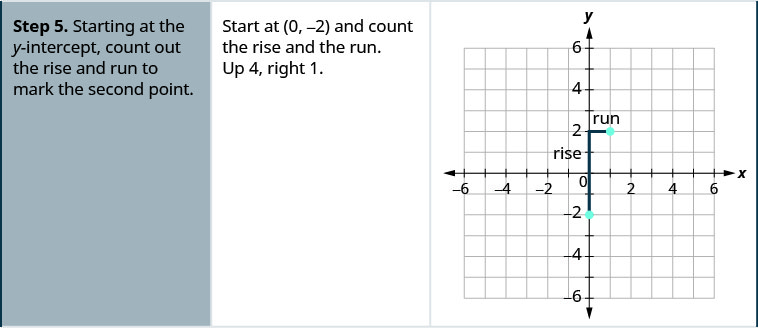
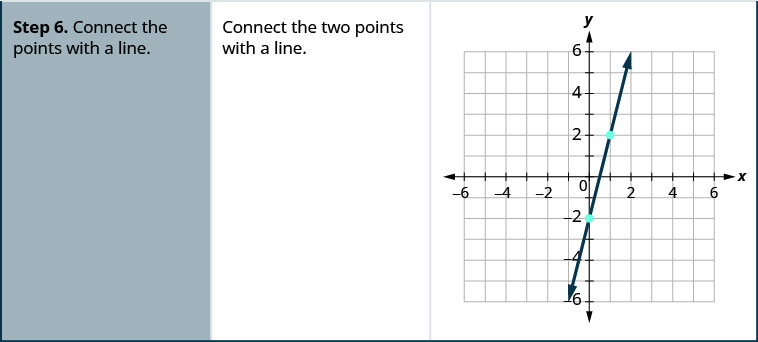
Try It (2)確認問題(2題)
Example 4.44例題 4.44
Graph the line of the equation using its slope and y-intercept.
英語のヒント
傾きとy切片を使って、方程式の直線を描く。
Solution解答
The equation is in slope–intercept form. 方程式は傾き・切片形である。 |
|
Identify the slope and y-intercept. 傾きとy切片を求める。 |
|
y-intercept is (0, 4) y切片は(0, 4)である。 |
|
Plot the y-intercept. y切片をとる。 |
See graph below. 下のグラフを参照する。 |
Identify the rise and the run. 縦と横の変化量を求める。 |
|
Count out the rise and run to mark the second point. 縦の変化量と横の変化量を数えて、2つ目の点に印を付ける。 |
rise −1, run 1 縦の変化量−1、横の変化量1 |
Draw the line. 直線を描く。 |
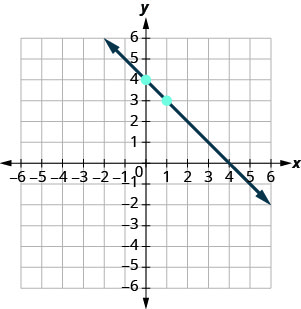 |
To check your work, you can find another point on the line and make sure it is a solution of the equation. In the graph we see the line goes through (4, 0). 直線上の別の点を求め、それが方程式の解であることを確かめれば、作図を確認できる。グラフを見ると、直線は(4, 0)を通っている。 |
|
Check. 確認する。 |
|
Try It (2)確認問題(2題)
Example 4.45例題 4.45
Graph the line of the equation using its slope and y-intercept.
英語のヒント
傾きとy切片を使って、方程式の直線を描く。
Solution解答
The equation is in slope–intercept form. 方程式は傾き・切片形である。 |
|
Identify the slope and y-intercept. 傾きとy切片を求める。 |
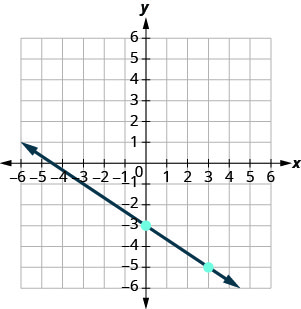
; y-intercept is (0, −3) ;y切片は(0, −3) |
Plot the y-intercept. y切片をとる。 |
See graph below. 下のグラフを参照する。 |
Identify the rise and the run. 縦と横の変化量を求める。 |
|
Count out the rise and run to mark the second point. 縦の変化量と横の変化量を数えて、2つ目の点に印を付ける。 |
|
Draw the line. 直線を描く。 |
 |
Try It (2)確認問題(2題)
Example 4.46例題 4.46
Graph the line of the equation using its slope and y-intercept.
英語のヒント
傾きとy切片を使って、方程式の直線を描く。
Solution解答
Find the slope–intercept form of the equation. 方程式を傾き・切片形にする。 |
|
The equation is now in slope–intercept form. これで方程式は傾き・切片形になった。 |
|
Identify the slope and y-intercept. 傾きとy切片を求める。 |
|
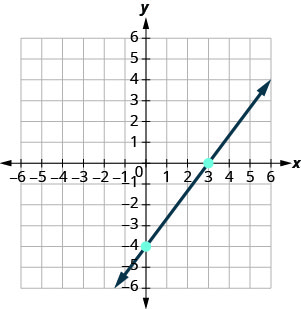
y-intercept is (0, −4) y切片は(0, −4) |
|
Plot the y-intercept. y切片をとる。 |
See graph below. 下のグラフを参照する。 |
Identify the rise and the run; count out the rise and run to mark the second point. 縦の変化量と横の変化量を特定し、それらを数えて2つ目の点に印を付ける。 |
|
Draw the line. 直線を描く。 |
 |
Try It (2)確認問題(2題)
We have used a grid with and both going from about to 10 for all the equations we’ve graphed so far. Not all linear equations can be graphed on this small grid. Often, especially in applications with real-world data, we’ll need to extend the axes to bigger positive or smaller negative numbers.
英語のヒント
これまで描いた方程式のグラフでは、とがともにおよそから10までの格子を使ってきた。しかし、すべての一次方程式をこの小さな格子に描けるわけではない。特に現実のデータを使う応用では、軸をさらに大きな正の数や小さな負の数まで延ばす必要があることが多い。
Example 4.47例題 4.47
Graph the line of the equation using its slope and y-intercept.
英語のヒント
傾きとy切片を使って、方程式の直線を描く。
Solution解答
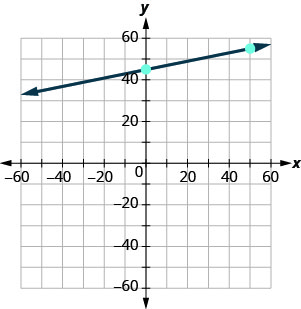
We’ll use a grid with the axes going from about to 80.
英語のヒント
軸がおよそから80までの格子を使う。
The equation is in slope–intercept form. 方程式は傾き・切片形である。 |
|
Identify the slope and y-intercept. 傾きとy切片を求める。 |
|
The y-intercept is (0, 45) y切片は(0, 45) |
|
Plot the y-intercept. y切片をとる。 |
See graph below. 下のグラフを参照する。 |
Count out the rise and run to mark the second point. The slope is ; in fraction form this means . Given the scale of our graph, it would be easier to use the equivalent fraction . 縦の変化量と横の変化量を数えて、2つ目の点に印を付ける。傾きはであり、分数で書けばである。グラフの目盛りを考えると、これに等しい分数を使うほうが簡単である。 |
|
Draw the line. 直線を描く。 |
 |
Try It (2)確認問題(2題)
Now that we have graphed lines by using the slope and y-intercept, let’s summarize all the methods we have used to graph lines. See Figure 4.25.
英語のヒント
傾きとy切片を使って直線のグラフを描いたので、これまで使ってきた作図方法をすべてまとめよう。図4.25を参照する。
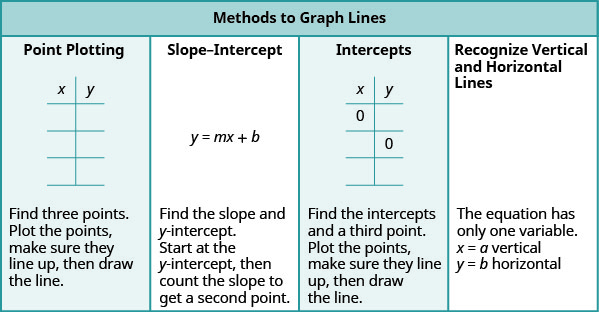
Figure 4.25図 4.25
Choose the Most Convenient Method to Graph a Line直線を描くのに最も便利な方法を選ぶ
Now that we have seen several methods we can use to graph lines, how do we know which method to use for a given equation?
英語のヒント
直線のグラフを描く方法をいくつか見てきたが、与えられた方程式にはどの方法を使えばよいとわかるのだろうか。
While we could plot points, use the slope–intercept form, or find the intercepts for any equation, if we recognize the most convenient way to graph a certain type of equation, our work will be easier. Generally, plotting points is not the most efficient way to graph a line. We saw better methods in sections 4.3, 4.4, and earlier in this section. Let’s look for some patterns to help determine the most convenient method to graph a line.
英語のヒント
どの方程式でも、点をとる方法、傾き・切片形を使う方法、切片を求める方法を使えるが、方程式の種類に応じて最も都合のよい方法がわかれば、作業は簡単になる。一般に、点をとる方法は直線を描く最も効率のよい方法ではない。4.3節、4.4節、この節の前半では、よりよい方法を見てきた。最も都合のよい作図方法を判断する助けになるパターンを探そう。
Here are six equations we graphed in this chapter, and the method we used to graph each of them.
英語のヒント
この章でグラフを描いた6つの方程式と、それぞれに使った方法を示す。
Equations #1 and #2 each have just one variable. Remember, in equations of this form the value of that one variable is constant; it does not depend on the value of the other variable. Equations of this form have graphs that are vertical or horizontal lines.
英語のヒント
方程式1と2は、それぞれ変数が1つだけである。この形の方程式では、その変数の値は一定であり、もう一方の変数の値にはよらないことを思い出そう。この形の方程式のグラフは、垂直または水平な直線である。
In equations #3 and #4, both and are on the same side of the equation. These two equations are of the form . We substituted to find the x-intercept and to find the y-intercept, and then found a third point by choosing another value for or .
英語のヒント
方程式3と4では、とがどちらも同じ辺にある。この2つはの形の方程式である。を代入してx切片を、を代入してy切片を求め、次にかの別の値を選んで3つ目の点を求めた。
Equations #5 and #6 are written in slope–intercept form. After identifying the slope and y-intercept from the equation we used them to graph the line.
英語のヒント
方程式5と6は傾き・切片形で書かれている。方程式から傾きとy切片を特定し、それらを使って直線のグラフを描いた。
This leads to the following strategy.
英語のヒント
これから、次の方針が得られる。
Example 4.48例題 4.48
Determine the most convenient method to graph each line.
英語のヒント
各直線のグラフを描くのに、最も都合のよい方法を決めよ。
ⓐ ⓑ ⓒ ⓓ .
Solution解答
- ⓐ
This equation has only one variable,. Its graph is a horizontal line crossing the y-axis at .英語のヒント
ⓐ この方程式の変数はの1つだけである。グラフは、y軸上のを通る水平な直線である。 - ⓑ
This equation is of the form . The easiest way to graph it will be to find the intercepts and one more point.英語のヒント
ⓑ この方程式はの形である。切片ともう1つの点を求めるのが、最も簡単な作図方法である。 - ⓒ
There is only one variable, . The graph is a vertical line crossing the x-axis at 7.英語のヒント
ⓒ 変数はの1つだけである。グラフは、x軸上の7を通る垂直な直線である。 - ⓓ
Since this equation is in form, it will be easiest to graph this line by using the slope and y-intercept.英語のヒント
ⓓ この方程式はの形なので、傾きとy切片を使うのが最も簡単な作図方法である。