第4章グラフ
Use to Find the Slope of a Line from its Graphを使ってグラフから直線の傾きを求める
Now, we’ll look at some graphs on the -coordinate plane and see how to find their slopes. The method will be very similar to what we just modeled on our geoboards.
英語のヒント
次に、座標平面上のグラフをいくつか見て、傾きの求め方を考える。方法は、先ほどジオボードで行ったこととよく似ている。
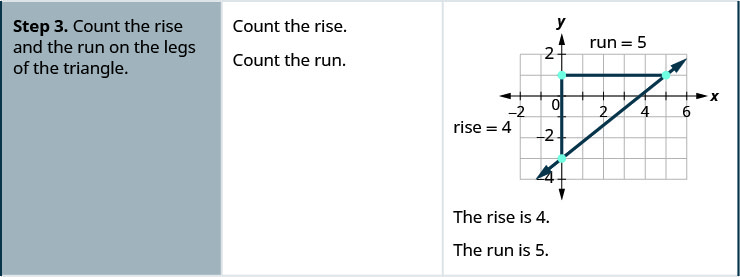
To find the slope, we must count out the rise and the run. But where do we start?
英語のヒント
傾きを求めるには、縦と横の変化量を数える必要がある。しかし、どこから始めればよいのだろうか。
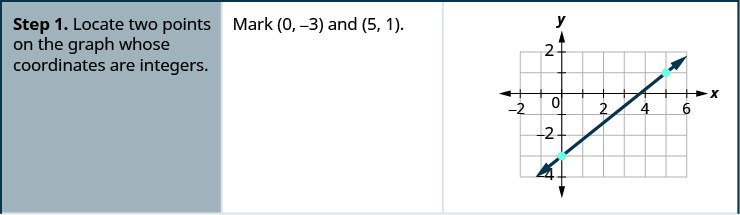
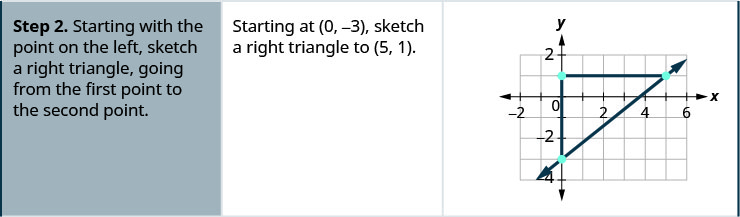
We locate two points on the line whose coordinates are integers. We then start with the point on the left and sketch a right triangle, so we can count the rise and run.
英語のヒント
直線上で、座標が整数である2点を見つける。次に左の点から始めて直角三角形を描き、縦の変化量と横の変化量を数えられるようにする。
Example 4.29例題 4.29
How to Use to Find the Slope of a Line from its Graphを使ってグラフから直線の傾きを求める方法
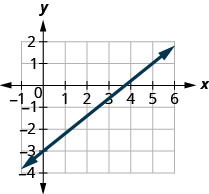
Find the slope of the line shown.
英語のヒント
図の直線の傾きを求める。
Solution解答
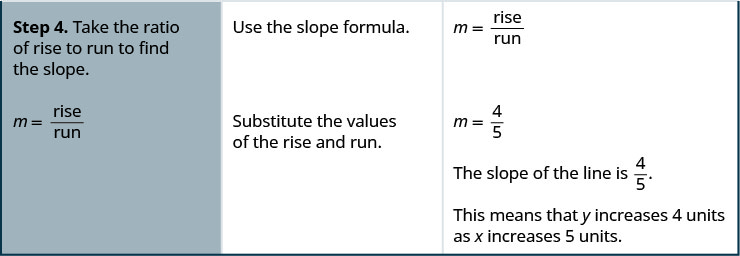
Try It (2)確認問題(2題)
Example 4.30例題 4.30
Find the slope of the line shown.
英語のヒント
図の直線の傾きを求める。
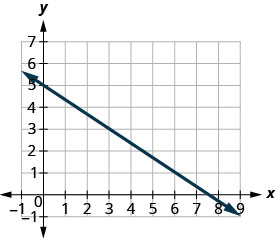
Solution解答
Locate two points on the graph whose coordinates are integers. グラフ上で座標が整数の2点を選ぶ。 |
and と |
Which point is on the left? どちらの点が左にあるか。 |
|
Starting at , sketch a right triangle to . から始めて、まで直角三角形を描く。 |
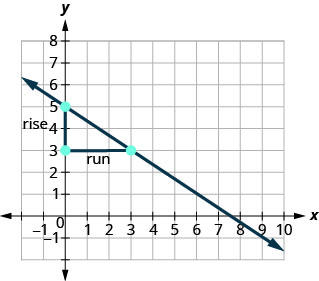 |
Count the rise—it is negative. 縦の変化量を数える。負になる。 |
The rise is . 縦の変化量はである。 |
Count the run. 横の変化量を数える。 |
The run is 3. 横の変化量は3である。 |
Use the slope formula. 傾きの公式を使う。 |
|
Substitute the values of the rise and run. 縦の変化量と横の変化量を代入する。 |
|
Simplify. 簡単にする。 |
|
The slope of the line is . 直線の傾きはである。 |
So decreases by 2 units as increases by 3 units.
英語のヒント
したがって、が3目盛り増えると、は2目盛り減る。
What if we used the points and to find the slope of the line?
英語のヒント
点とを使って直線の傾きを求めたら、どうなるだろうか。
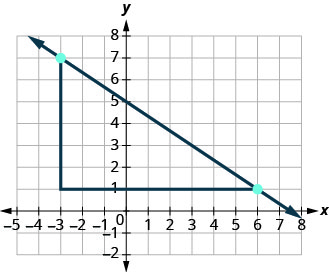
The rise would be and the run would be 9. Then , and that simplifies to . Remember, it does not matter which points you use—the slope of the line is always the same.
英語のヒント
縦の変化量は、横の変化量は9になる。するととなり、簡単にするとである。どの点を使っても関係なく、直線の傾きは常に同じであることを思い出そう。
Try It (2)確認問題(2題)
In the last two examples, the lines had y-intercepts with integer values, so it was convenient to use the y-intercept as one of the points to find the slope. In the next example, the y-intercept is a fraction. Instead of using that point, we’ll look for two other points whose coordinates are integers. This will make the slope calculations easier.
英語のヒント
直前の2つの例ではy切片の値が整数だったので、傾きを求める2点のうちの1点にy切片を使うと便利だった。次の例ではy切片が分数である。その点を使う代わりに、座標が整数である別の2点を探そう。そうすると、傾きの計算が簡単になる。
Example 4.31例題 4.31
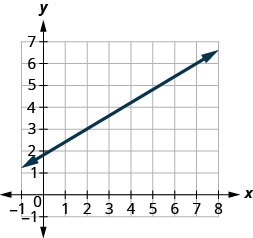
Find the slope of the line shown.
英語のヒント
図の直線の傾きを求める。
Solution解答
Locate two points on the graph whose coordinates are integers. グラフ上で座標が整数の2点を選ぶ。 |
and と |
Which point is on the left? どちらの点が左にあるか。 |
|
Starting at , sketch a right triangle to . から始めて、まで直角三角形を描く。 |
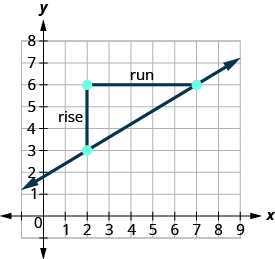 |
Count the rise. 縦の変化量を数える。 |
The rise is 3. 縦の変化量は3である。 |
Count the run. 横の変化量を数える。 |
The run is 5. 横の変化量は5である。 |
Use the slope formula. 傾きの公式を使う。 |
|
Substitute the values of the rise and run. 縦の変化量と横の変化量を代入する。 |
|
The slope of the line is . 直線の傾きはである。 |
This means that increases 5 units as increases 3 units.
英語のヒント
これは、が3目盛り増えると、が5目盛り増えることを意味する。
When we used geoboards to introduce the concept of slope, we said that we would always start with the point on the left and count the rise and the run to get to the point on the right. That way the run was always positive and the rise determined whether the slope was positive or negative.
英語のヒント
ジオボードで傾きの概念を導入したときには、常に左の点から始めて、右の点まで縦の変化量と横の変化量を数えると述べた。その方法なら横の変化量は常に正であり、傾きが正か負かは縦の変化量によって決まった。
What would happen if we started with the point on the right?
英語のヒント
右の点から始めたら、どうなるだろうか。
Let’s use the points and again, but now we’ll start at .
英語のヒント
点とをもう一度使おう。ただし、今度はから始める。
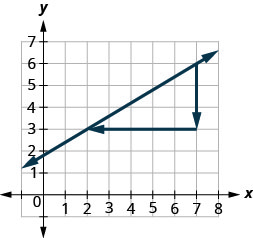
Count the rise. 縦の変化量を数える。 |
The rise is . 縦の変化量はである。 |
Count the run. It goes from right to left, so it is negative. 横の変化量を数える。右から左へ進むので、負になる。 |
The run is . 横の変化量はである。 |
Use the slope formula. 傾きの公式を使う。 |
|
Substitute the values of the rise and run. 縦の変化量と横の変化量を代入する。 |
|
The slope of the line is . 直線の傾きはである。 |
It does not matter where you start—the slope of the line is always the same.
英語のヒント
どこから始めても関係なく、直線の傾きは常に同じである。