第4章グラフ
4.4 Understand Slope of a Line4.4 直線の傾きを理解する
Learning Objectives学習目標
Learning Objectives学習目標
By the end of this section, you will be able to:
英語のヒント
この節を終えると、次のことができるようになる。
- Use geoboards to model slope
英語のヒント
ジオボードで傾きを表す - Use to find the slope of a line from its graph
英語のヒント
を使ってグラフから直線の傾きを求める - Find the slope of horizontal and vertical lines
英語のヒント
水平な直線と垂直な直線の傾きを求める - Use the slope formula to find the slope of a line between two points
英語のヒント
傾きの公式を使って2点を通る直線の傾きを求める - Graph a line given a point and the slope
英語のヒント
1点と傾きが与えられた直線のグラフを描く - Solve slope applications
英語のヒント
傾きの応用問題を解く
Before You Begin (3)準備問題(3題)
When you graph linear equations, you may notice that some lines tilt up as they go from left to right and some lines tilt down. Some lines are very steep and some lines are flatter. What determines whether a line tilts up or down or if it is steep or flat?
英語のヒント
一次方程式のグラフを描くと、左から右へ進むにつれて上がる直線と、下がる直線があることに気づくだろう。非常に急な直線もあれば、より平らな直線もある。直線が上向きか下向きか、急か緩やかかは、何によって決まるのだろうか。
In mathematics, the ‘tilt’ of a line is called the slope of the line. The concept of slope has many applications in the real world. The pitch of a roof, grade of a highway, and a ramp for a wheelchair are some examples where you literally see slopes. And when you ride a bicycle, you feel the slope as you pump uphill or coast downhill.
英語のヒント
数学では、直線の「傾き具合」をその直線の傾きという。傾きの概念は、現実の世界で多くの用途がある。屋根の勾配、道路の勾配、車椅子用のスロープは、文字どおり傾きが目に見える例である。自転車に乗るときには、上り坂でペダルを踏んだり、下り坂を惰性で進んだりすると、傾きを感じる。
In this section, we will explore the concept of slope.
英語のヒント
この節では、傾きの概念を詳しく見ていく。
Use Geoboards to Model Slopeジオボードを使って傾きを表す
A geoboard is a board with a grid of pegs on it. Using rubber bands on a geoboard gives us a concrete way to model lines on a coordinate grid. By stretching a rubber band between two pegs on a geoboard, we can discover how to find the slope of a line.
英語のヒント
ジオボードは、格子状にペグを並べた板である。ジオボードに輪ゴムをかけると、座標の格子上の直線を具体的に表せる。2本のペグの間に輪ゴムを張ることで、直線の傾きの求め方を見つけられる。
Additional Resources追加教材
We’ll start by stretching a rubber band between two pegs as shown in Figure 4.19.
英語のヒント
まず、図4.19のように、2本のペグの間に輪ゴムを張る。
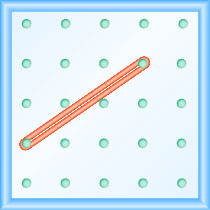
Figure 4.19図 4.19
Doesn’t it look like a line?
英語のヒント
直線のように見えないだろうか。
Now we stretch one part of the rubber band straight up from the left peg and around a third peg to make the sides of a right triangle, as shown in Figure 4.20
英語のヒント
次に図4.20のように、輪ゴムの一部を左側のペグから真上に引き伸ばし、3本目のペグにかけて、直角三角形の辺を作る。
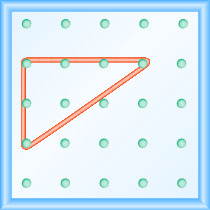
Figure 4.20図 4.20
We carefully make a 90º angle around the third peg, so one of the newly formed lines is vertical and the other is horizontal.
英語のヒント
3本目のペグのところが90度になるように注意して張ると、新しくできた2本の線のうち、一方が垂直、もう一方が水平になる。
To find the slope of the line, we measure the distance along the vertical and horizontal sides of the triangle. The vertical distance is called the rise and the horizontal distance is called the run, as shown in Figure 4.21.
英語のヒント
直線の傾きを求めるために、三角形の垂直な辺と水平な辺に沿った距離を測る。図4.21に示すように、垂直方向の距離を縦の変化量(rise)、水平方向の距離を横の変化量(run)という。
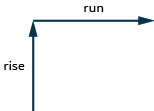
Figure 4.21図 4.21
If our geoboard and rubber band look just like the one shown in Figure 4.22, the rise is 2. The rubber band goes up 2 units. (Each space is one unit.)
英語のヒント
ジオボードと輪ゴムが図4.22と同じなら、縦の変化量は2である。輪ゴムは上に2目盛り進む。(1区間が1目盛りである。)
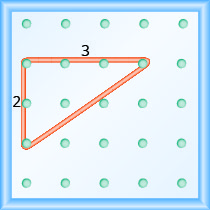
Figure 4.22図 4.22
The rise on this geoboard is 2, as the rubber band goes up two units.
英語のヒント
輪ゴムが上に2目盛り進むので、このジオボードの縦の変化量は2である。
What is the run?
英語のヒント
横の変化量はいくつか。
The rubber band goes across 3 units. The run is 3 (see Figure 4.22).
英語のヒント
輪ゴムは横に3目盛り進む。横の変化量は3である(図4.22参照)。
The slope of a line is the ratio of the rise to the run. In mathematics, it is always referred to with the letter .
英語のヒント
直線の傾きは、縦の変化量と横の変化量の比である。数学では、常に文字で表す。
The line has slope . This means that the line rises 2 units for every 3 units of run.
英語のヒント
直線の傾きはである。これは、横に3目盛り進むごとに、直線が上に2目盛り進むことを意味する。
When we work with geoboards, it is a good idea to get in the habit of starting at a peg on the left and connecting to a peg to the right. If the rise goes up it is positive and if it goes down it is negative. The run will go from left to right and be positive.
英語のヒント
ジオボードを使うときには、左のペグから始めて右のペグへつなぐ習慣をつけるとよい。縦の変化量は上向きなら正、下向きなら負である。横は左から右へ進むので、横の変化量は正になる。
Example 4.25例題 4.25
What is the slope of the line on the geoboard shown?
英語のヒント
図のジオボード上の直線の傾きはいくつか。
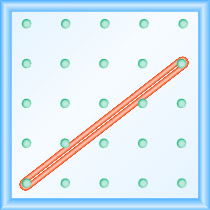
Solution解答
Use the definition of slope:
英語のヒント
傾きの定義を使う:
Start at the left peg and count the spaces up and to the right to reach the second peg.
英語のヒント
左のペグから始めて、2本目のペグまで上と右に何区間あるか数える。
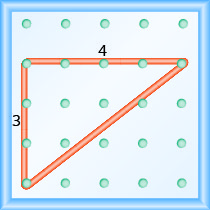
The rise is 3. 縦の変化量は3である。 |
|
The run is 4. 横の変化量は4である。 |
|
The slope is . 傾きはである。 |
This means that the line rises 3 units for every 4 units of run.
英語のヒント
これは、横に4目盛り進むごとに、直線が上に3目盛り進むことを意味する。
Try It (2)確認問題(2題)
Example 4.26例題 4.26
What is the slope of the line on the geoboard shown?
英語のヒント
図のジオボード上の直線の傾きはいくつか。
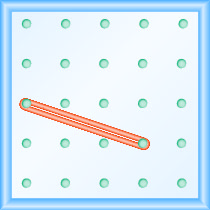
Solution解答
Use the definition of slope:
英語のヒント
傾きの定義を使う:
Start at the left peg and count the units down and to the right to reach the second peg.
英語のヒント
左のペグから始めて、2本目のペグまで下と右に何目盛りあるか数える。
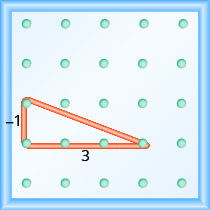
The rise is −1. 縦の変化量は−1である。 |
|
The run is 3. 横の変化量は3である。 |
|
The slope is . 傾きはである。 |
This means that the line drops 1 unit for every 3 units of run.
英語のヒント
これは、横に3目盛り進むごとに、直線が下に1目盛り進むことを意味する。
Try It (2)確認問題(2題)
Notice that in Example 4.25 the slope is positive and in Example 4.26 the slope is negative. Do you notice any difference in the two lines shown in Figure 4.23(a) and Figure 4.23(b)?
英語のヒント
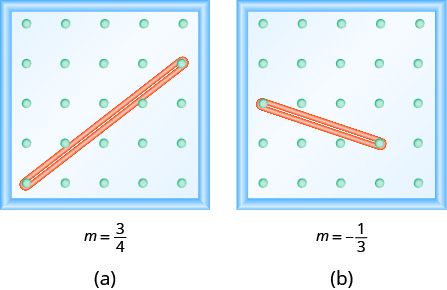
Figure 4.23図 4.23
We ‘read’ a line from left to right just like we read words in English. As you read from left to right, the line in Figure 4.23(a) is going up; it has positive slope. The line in Figure 4.23(b) is going down; it has negative slope.
英語のヒント
Example 4.27例題 4.27
Use a geoboard to model a line with slope .
英語のヒント
ジオボードを使って、傾きがの直線を作れ。
Solution解答
To model a line on a geoboard, we need the rise and the run.
英語のヒント
ジオボードで直線を作るには、縦の変化量と横の変化量が必要である。
Use the slope formula. 傾きの公式を使う。 |
|
Replace with . をに置き換える。 |
So, the rise is 1 and the run is 2.
英語のヒント
したがって、縦の変化量は1、横の変化量は2である。
Start at a peg in the lower left of the geoboard.
英語のヒント
ジオボードの左下のペグから始める。
Stretch the rubber band up 1 unit, and then right 2 units.
英語のヒント
輪ゴムを上に1目盛り、次に右に2目盛り伸ばす。
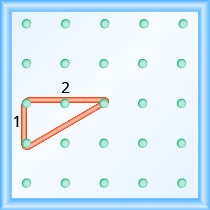
The hypotenuse of the right triangle formed by the rubber band represents a line whose slope is .
英語のヒント
輪ゴムでできた直角三角形の斜辺が、傾きの直線を表す。
Try It (2)確認問題(2題)
Example 4.28例題 4.28
Use a geoboard to model a line with slope
英語のヒント
ジオボードを使って、傾きがの直線を作れ。
Solution解答
Use the slope formula. 傾きの公式を使う。 |
|
Replace with . をに置き換える。 |
So, the rise is and the run is 4.
英語のヒント
したがって、縦の変化量は、横の変化量は4である。
Since the rise is negative, we choose a starting peg on the upper left that will give us room to count down.
英語のヒント
縦の変化量が負なので、下向きに数える余地があるよう、左上のペグを出発点に選ぶ。
We stretch the rubber band down 1 unit, then go to the right 4 units, as shown.
英語のヒント
図のように、輪ゴムを下に1目盛り伸ばし、次に右に4目盛り進む。
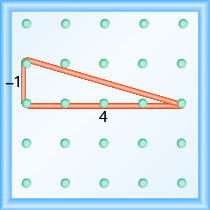
The hypotenuse of the right triangle formed by the rubber band represents a line whose slope is .
英語のヒント
輪ゴムでできた直角三角形の斜辺が、傾きの直線を表す。