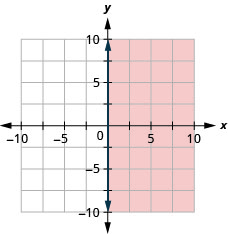
第4章グラフ
Graph Linear Inequalities一次不等式のグラフを描く
Now, we’re ready to put all this together to graph linear inequalities.
英語のヒント
これで、学んだことをすべて組み合わせて、一次不等式のグラフを描く準備ができた。
Example 4.72例題 4.72
How to Graph Linear Inequalities一次不等式のグラフを描く方法
Graph the linear inequality .
英語のヒント
一次不等式のグラフを描く。
Solution解答
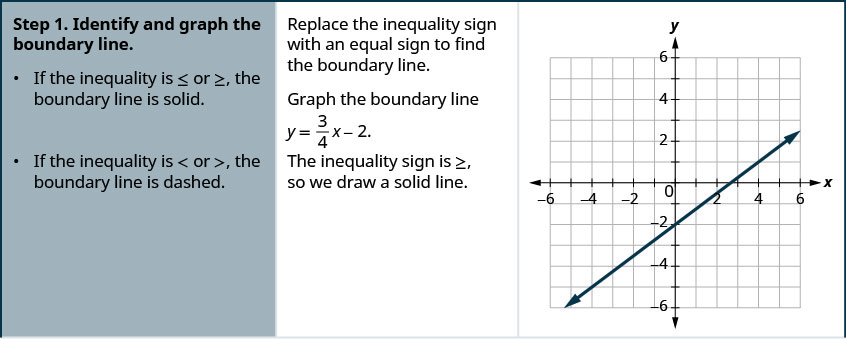
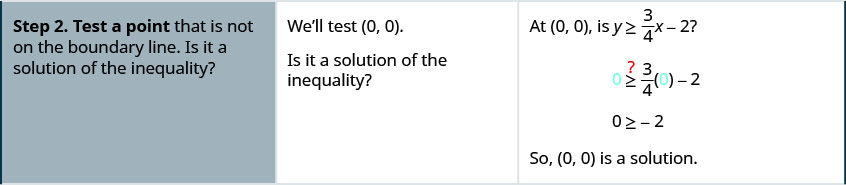
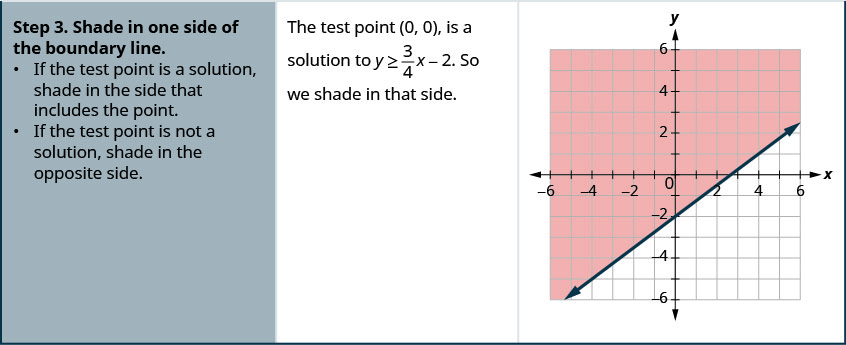
Try It (2)確認問題(2題)
The steps we take to graph a linear inequality are summarized here.
英語のヒント
一次不等式のグラフを描く手順を、ここにまとめる。
Example 4.73例題 4.73
Graph the linear inequality .
英語のヒント
一次不等式のグラフを描く。
Solution解答
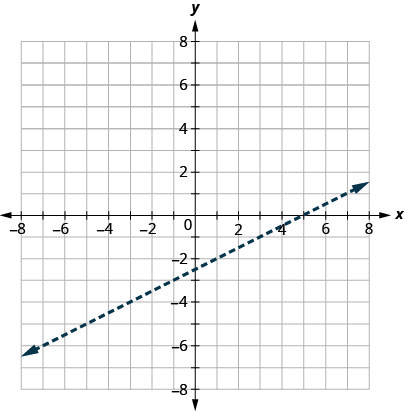
First we graph the boundary line . The inequality is so we draw a dashed line.
英語のヒント
まず、境界線のグラフを描く。不等号はなので、破線を描く。
Then we test a point. We’ll use again because it is easy to evaluate and it is not on the boundary line.
英語のヒント
次に、ある点を調べる。値を求めるのが簡単で、境界線上にないので、ここでもを使う。
Is a solution of ?
英語のヒント
はの解だろうか。
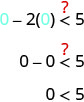
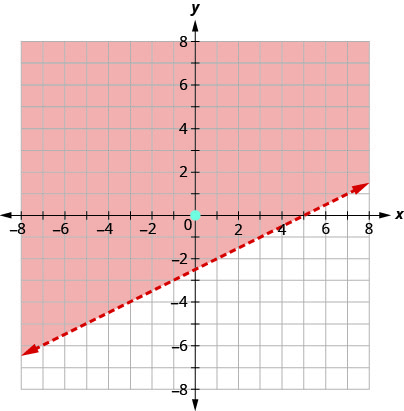
The point is a solution of , so we shade in that side of the boundary line.
英語のヒント
点はの解なので、境界線のその側に色を付ける。
Try It (2)確認問題(2題)
What if the boundary line goes through the origin? Then we won’t be able to use as a test point. No problem—we’ll just choose some other point that is not on the boundary line.
英語のヒント
境界線が原点を通る場合はどうか。その場合は、調べる点にを使えない。問題はない。境界線上にない別の点を選べばよい。
Example 4.74例題 4.74
Graph the linear inequality .
英語のヒント
一次不等式のグラフを描く。
Solution解答
First we graph the boundary line . It is in slope–intercept form, with . The inequality is so we draw a solid line.
英語のヒント
まず、境界線のグラフを描く。傾き・切片形であり、である。不等号はなので、実線を描く。
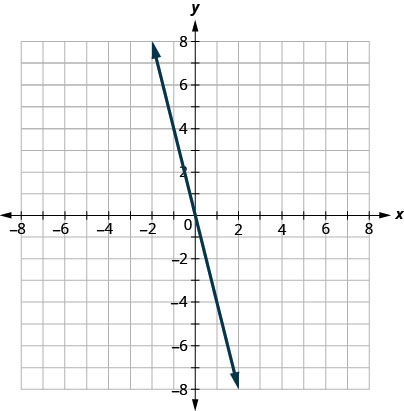
Now, we need a test point. We can see that the point is not on the boundary line.
英語のヒント
次に、調べる点が必要である。点は境界線上にないことがわかる。
Is a solution of ?
英語のヒント
はの解だろうか。

The point is not a solution to , so we shade in the opposite side of the boundary line. See Figure 4.35.
英語のヒント
点はの解ではないので、境界線の反対側に色を付ける。図4.35を参照する。
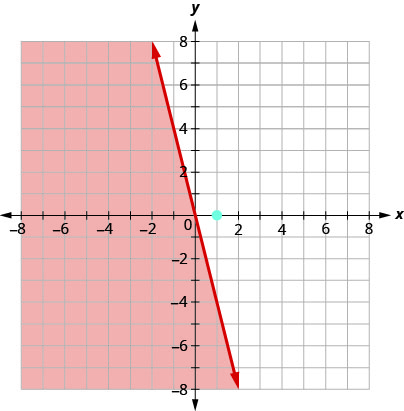
Figure 4.35図 4.35
Try It (2)確認問題(2題)
Some linear inequalities have only one variable. They may have an x but no y, or a y but no x. In these cases, the boundary line will be either a vertical or a horizontal line. Do you remember?
英語のヒント
一次不等式の中には、変数が1つだけのものもある。xがあってyがない場合や、yがあってxがない場合である。この場合、境界線は垂直または水平な直線になる。覚えているだろうか。
Example 4.75例題 4.75
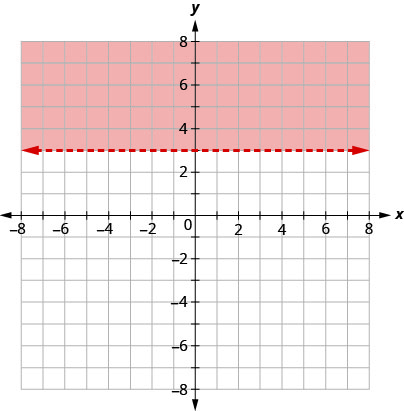
Graph the linear inequality .
英語のヒント
一次不等式のグラフを描く。
Solution解答
First we graph the boundary line . It is a horizontal line. The inequality is > so we draw a dashed line.
英語のヒント
まず、境界線のグラフを描く。水平な直線である。不等号は>なので、破線を描く。
We test the point .
英語のヒント
点を調べる。
is not a solution to .
英語のヒント
はの解ではない。
So we shade the side that does not include (0, 0).
英語のヒント
したがって、(0, 0)を含まない側に色を付ける。
Try It (2)確認問題(2題)
Key Concepts重要な概念
- To Graph a Linear Inequality
英語のヒント
一次不等式のグラフを描くには- Identify and graph the boundary line.
If the inequality is , the boundary line is solid.
If the inequality is < or >, the boundary line is dashed.英語のヒント
境界線を特定して描く。不等号がなら、境界線は実線である。不等号が<または>なら、境界線は破線である。 - Test a point that is not on the boundary line. Is it a solution of the inequality?
英語のヒント
境界線上にない点を調べる。不等式の解だろうか。 - Shade in one side of the boundary line.
If the test point is a solution, shade in the side that includes the point.
If the test point is not a solution, shade in the opposite side.英語のヒント
境界線の片側に色を付ける。調べた点が解なら、その点を含む側に色を付ける。解でなければ、反対側に色を付ける。
Section Exercises節の練習問題
Practice Makes Perfect練習問題
Exercises 504–509練習問題 504–509
Verify Solutions to an Inequality in Two Variables
英語のヒント
2変数の不等式の解を確かめる
In the following exercises, determine whether each ordered pair is a solution to the given inequality.
英語のヒント
次の練習問題では、各順序対が与えられた不等式の解かどうか判定せよ。
Exercise 504問題 504
Determine whether each ordered pair is a solution to the inequality :
英語のヒント
それぞれの順序対が不等式の解かどうかを判定する:
- ⓐ
- ⓑ
- ⓒ
- ⓓ
- ⓔ
Exercise 505問題 505
Determine whether each ordered pair is a solution to the inequality :
英語のヒント
それぞれの順序対が不等式の解かどうかを判定する:
- ⓐ
- ⓑ
- ⓒ
- ⓓ
- ⓔ
Solution解き方
ⓐ yes ⓑ yes ⓒ no ⓓ yes ⓔ yes
ⓐ はい ⓑ はい ⓒ いいえ ⓓ はい ⓔ はい
Exercise 506問題 506
Determine whether each ordered pair is a solution to the inequality :
英語のヒント
それぞれの順序対が不等式の解かどうかを判定する:
- ⓐ
- ⓑ
- ⓒ
- ⓓ
- ⓔ
Exercise 507問題 507
Determine whether each ordered pair is a solution to the inequality :
英語のヒント
それぞれの順序対が不等式の解かどうかを判定する:
- ⓐ
- ⓑ
- ⓒ
- ⓓ
- ⓔ
Solution解き方
ⓐ yes ⓑ no ⓒ yes ⓓ yes ⓔ yes
ⓐ はい ⓑ いいえ ⓒ はい ⓓ はい ⓔ はい
Exercise 508問題 508
Determine whether each ordered pair is a solution to the inequality :
英語のヒント
それぞれの順序対が不等式の解かどうかを判定する:
- ⓐ
- ⓑ
- ⓒ
- ⓓ
- ⓔ
Exercise 509問題 509
Determine whether each ordered pair is a solution to the inequality :
英語のヒント
それぞれの順序対が不等式の解かどうかを判定する:
- ⓐ
- ⓑ
- ⓒ
- ⓓ
- ⓔ
Solution解き方
ⓐ no ⓑ no ⓒ no ⓓ yes ⓔ yes
ⓐ いいえ ⓑ いいえ ⓒ いいえ ⓓ はい ⓔ はい
Exercises 510–521練習問題 510–521
Recognize the Relation Between the Solutions of an Inequality and its Graph
英語のヒント
不等式の解とグラフの関係を理解する
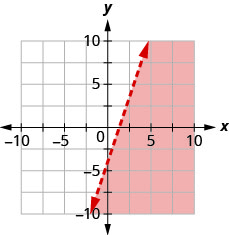
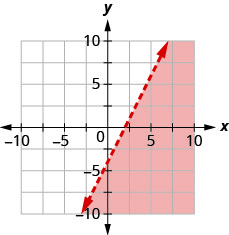
In the following exercises, write the inequality shown by the shaded region.
英語のヒント
次の練習問題では、色の付いた領域が表す不等式を書け。
Exercise 510問題 510
Write the inequality shown by the graph with the boundary line
英語のヒント
境界線がであるグラフが表す不等式を書け。
Exercise 511問題 511
Write the inequality shown by the graph with the boundary line
英語のヒント
境界線がであるグラフが表す不等式を書け。
Solution解き方
Exercise 512問題 512
Write the inequality shown by the graph with the boundary line
英語のヒント
境界線がであるグラフが表す不等式を書け。
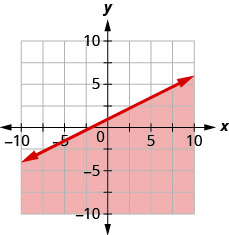
Exercise 513問題 513
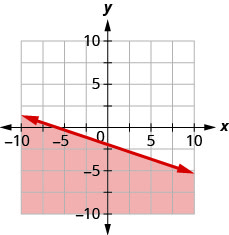
Write the inequality shown by the graph with the boundary line
英語のヒント
境界線がであるグラフが表す不等式を書け。
Solution解き方
Exercise 514問題 514
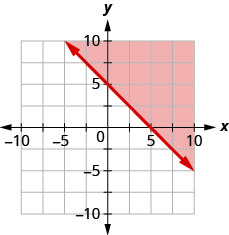
Write the inequality shown by the shaded region in the graph with the boundary line
英語のヒント
境界線がであるグラフの色を付けた領域が表す不等式を書く。
Exercise 515問題 515
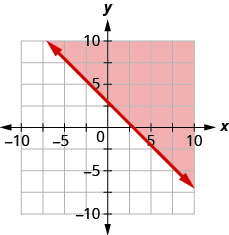
Write the inequality shown by the shaded region in the graph with the boundary line
英語のヒント
境界線がであるグラフの色を付けた領域が表す不等式を書く。
Solution解き方
Exercise 516問題 516
Write the inequality shown by the shaded region in the graph with the boundary line
英語のヒント
境界線がであるグラフの色を付けた領域が表す不等式を書く。
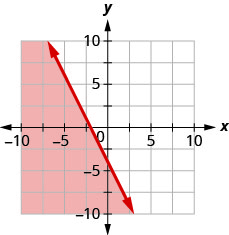
Exercise 517問題 517
Write the inequality shown by the shaded region in the graph with the boundary line
英語のヒント
境界線がであるグラフの色を付けた領域が表す不等式を書く。
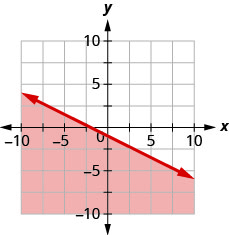
Solution解き方
Exercise 518問題 518
Write the inequality shown by the shaded region in the graph with the boundary line
英語のヒント
境界線がであるグラフの色を付けた領域が表す不等式を書く。
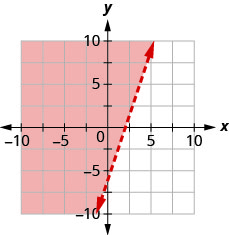
Exercise 519問題 519
Write the inequality shown by the shaded region in the graph with the boundary line
英語のヒント
境界線がであるグラフの色を付けた領域が表す不等式を書く。
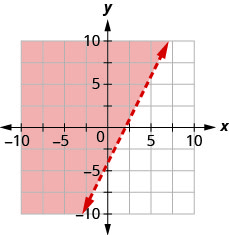
Solution解き方
Exercise 520問題 520
Write the inequality shown by the shaded region in the graph with the boundary line
英語のヒント
境界線がであるグラフの色を付けた領域が表す不等式を書く。
Exercise 521問題 521
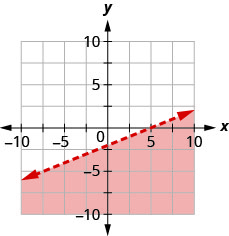
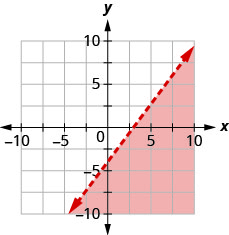
Write the inequality shown by the shaded region in the graph with the boundary line
英語のヒント
境界線がであるグラフの色を付けた領域が表す不等式を書く。
Solution解き方
Exercises 522–551練習問題 522–551
Graph Linear Inequalities
英語のヒント
一次不等式のグラフを描く
In the following exercises, graph each linear inequality.
英語のヒント
次の練習問題では、各一次不等式のグラフを描け。
Exercise 522問題 522
Graph the linear inequality .
英語のヒント
一次不等式のグラフを描く。
Exercise 523問題 523
Graph the linear inequality .
英語のヒント
一次不等式のグラフを描く。
Solution解き方
Exercise 524問題 524
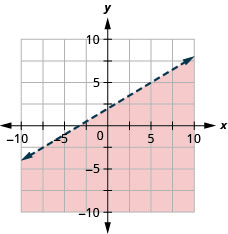
Graph the linear inequality .
英語のヒント
一次不等式のグラフを描く。
Exercise 525問題 525
Graph the linear inequality .
英語のヒント
一次不等式のグラフを描く。
Solution解き方
Exercise 526問題 526
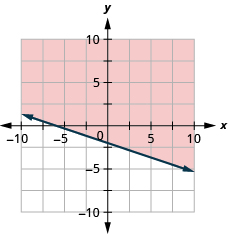
Graph the linear inequality .
英語のヒント
一次不等式のグラフを描く。
Exercise 527問題 527
Graph the linear inequality .
英語のヒント
一次不等式のグラフを描く。
Solution解き方
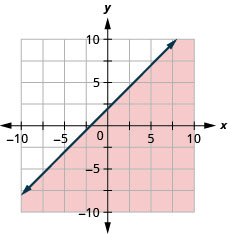
Exercise 528問題 528
Graph the linear inequality .
英語のヒント
一次不等式のグラフを描く。
Exercise 529問題 529
Graph the linear inequality .
英語のヒント
一次不等式のグラフを描く。
Solution解き方
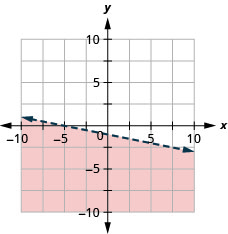
Exercise 530問題 530
Graph the linear inequality .
英語のヒント
一次不等式のグラフを描く。
Exercise 531問題 531
Graph the linear inequality .
英語のヒント
一次不等式のグラフを描く。
Solution解き方
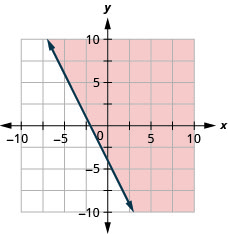
Exercise 532問題 532
Graph the linear inequality .
英語のヒント
一次不等式のグラフを描く。
Exercise 533問題 533
Graph the linear inequality .
英語のヒント
一次不等式のグラフを描く。
Solution解き方
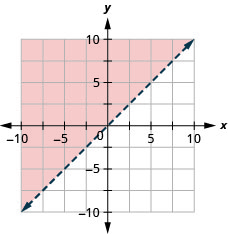
Exercise 534問題 534
Graph the linear inequality .
英語のヒント
一次不等式のグラフを描く。
Exercise 535問題 535
Graph the linear inequality .
英語のヒント
一次不等式のグラフを描く。
Solution解き方
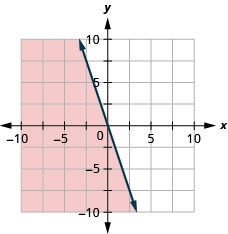
Exercise 536問題 536
Graph the linear inequality .
英語のヒント
一次不等式のグラフを描く。
Exercise 537問題 537
Graph the linear inequality .
英語のヒント
一次不等式のグラフを描く。
Solution解き方
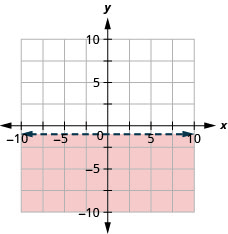
Exercise 538問題 538
Graph the linear inequality .
英語のヒント
一次不等式のグラフを描く。
Exercise 539問題 539
Graph the linear inequality .
英語のヒント
一次不等式のグラフを描く。
Solution解き方
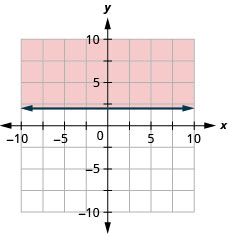
Exercise 540問題 540
Graph the linear inequality .
英語のヒント
一次不等式のグラフを描く。
Exercise 541問題 541
Graph the linear inequality .
英語のヒント
一次不等式のグラフを描く。
Solution解き方
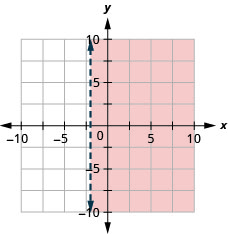
Exercise 542問題 542
Graph the linear inequality .
英語のヒント
一次不等式のグラフを描く。
Exercise 543問題 543
Graph the linear inequality .
英語のヒント
一次不等式のグラフを描く。
Solution解き方
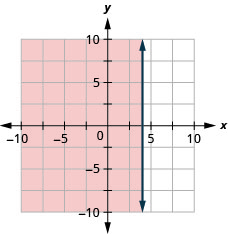
Exercise 544問題 544
Graph the linear inequality .
英語のヒント
一次不等式のグラフを描く。
Exercise 545問題 545
Graph the linear inequality .
英語のヒント
一次不等式のグラフを描く。
Solution解き方
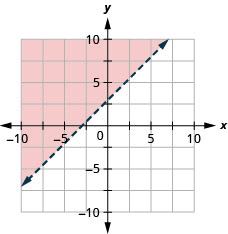
Exercise 546問題 546
Graph the linear inequality .
英語のヒント
一次不等式のグラフを描く。
Exercise 547問題 547
Graph the linear inequality .
英語のヒント
一次不等式のグラフを描く。
Solution解き方
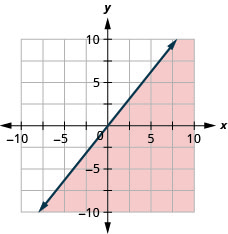
Exercise 548問題 548
Graph the linear inequality .
英語のヒント
一次不等式のグラフを描く。
Exercise 549問題 549
Graph the linear inequality .
英語のヒント
一次不等式のグラフを描く。
Solution解き方
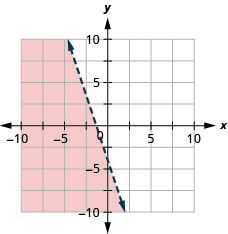
Exercise 550問題 550
Graph the linear inequality .
英語のヒント
一次不等式のグラフを描く。
Exercise 551問題 551
Graph the linear inequality .
英語のヒント
一次不等式のグラフを描く。
Solution解き方